ORIGINAL ARTICLE
Monitoring vegetation using remote sensing time series data: a review of the period 1996-2017
Monitoreo de vegetación utilizando datos de series de tiempo de teledetección: una revisión de 1996-2017
José Manuel Zúñiga-Vásquez 1, Carlos Arturo Aguirre-Salado 2, Marín Pompa-García 1*
1 Universidad Juárez del Estado de Durango. Facultad de Ciencias Forestales. Río Papaloapan y Blvd. Durango s/n. Col. Valle del Sur. 34120, Durango. Durango, México. josema.zuva@gmail.com, * mpgarcia@ujed.mx
2 Universidad Autónoma de San Luis Potosí. Facultad de Ingeniería. Manuel Nava N° 8. Zona Universitaria. 78280. San Luis Potosí. S. L. P. México. carlos.aguirre@uaslp.mx
Originales: Recepción: 17/05/2018 - Aceptación: 04/07/2019
ABSTRACT
Analyzing time series data with remote sensing provides a better understanding of vegetation dynamics, since previous conditions and changes that have occurred over a given period are known. The objective of this paper was to analyze the current status and recent advances in the use of time series data obtained from remote sensors for vegetation monitoring. A systematic search of scientific papers was performed and 167 papers were found, published during the period 1996 to 2017. No significant difference in the amount of years analyzed was found between time series analyzed with a single sensor and those analyzed with a combination of several sensors (i.e. Landsat and SPOT, Landsat and Sentinel, among others). However, the combination of data from different sensors (fusion of images) can improve the quality of the results. Special attention must also be given to the fusion of optical and radar data, since this offers more unique spectral and structural information for land cover and land use assessments.
Keywords: Phenology; Land cover; Analysis of multi-temporal remote sensing; Spatio-temporal analysis; Image fusion
RESUMEN
El análisis de datos de series de tiempo con sensores remotos proporciona una mejor comprensión de la dinámica de la vegetación, ya que se conocen las condiciones y cambios previos que se han producido en un período determinado. El objetivo de este trabajo fue analizar el estado actual y los avances recientes en el uso de datos de series de tiempo obtenidos de sensores remotos para el monitoreo de vegetación. Se realizó una búsqueda sistemática de artículos científicos y se encontraron 167 artículos publicados entre 1996 y 2017. No se encontraron diferencias significativas en la cantidad de años analizados entre las series temporales analizadas con un solo sensor y aquellas analizadas con una combinación de varios sensores (es decir, Landsat y SPOT, Landsat y Sentinel, entre otros). El número de años analizados con datos de series de tiempo fue similar, ya sea utilizando un solo sensor o una combinación de diferentes sensores. Sin embargo, la combinación de datos de diferentes sensores (fusión de imágenes) puede mejorar la calidad de los resultados. También se debe prestar especial atención a la fusión de datos ópticos y de radar, ya que ofrecen información espectral y estructural más exclusiva para las evaluaciones de la cubierta terrestre y el uso de la tierra.
Palabras clave: Fenología; Cobertura de la tierra; Análisis multi-temporal de teledetección; Análisis espacio-temporal; Fusión de imágenes
INTRODUCTION
Characterizing plant cover is essential for managing natural resources, modeling environmental variables and understanding habitat distribution (14). Vegetation dynamics have been monitored using a variety of approaches, from observational methods conducted directly in the field (26) to those based on remote sensing (2) from plot level (1), to regional (9, 37) and global scales (7). Different vegetation classes or types can be identified by their unique spectral characteristics i.e. reflectance or emissivity (44). Thus, remote sensing offers an advantageous method of monitoring since imagery can cover large geographic areas, and has become an essential method for understanding large-scale environmental changes (22). While a plethora of remote sensors exist, those most commonly applied in vegetation monitoring include Landsat (TM, ETM + and currently Landsat 8 OLI), SPOT, MODIS, NOAA-AVHRR, IKONOS and QuickBird (36, 44).
In recent years, sensor capabilities have considerably improved in terms of spatial, spectral and temporal resolution (44). This technological evolution provides information in greater quantity and with improved precision (5). Increased accessibility to remote sensing data and greater computing capacity have completely changed the way of using these data. At present, the use of more complex analysis with novel algorithms for detecting changes in vegetation cover using time series data is becoming more frequent (46). Although there is current research that reports trends in the use of time series data, these studies only report trends for a single sensor (e.g. Landsat) (4, 46), while other remote sensors have not been the subject of extensive review. It is therefore necessary to report trends in the use of time series data for the monitoring of vegetation with respect to more sensors, greater periodicity and involving the study of more ecosystems. For this reason, the main objective of this research was to analyze the current status and recent advances in the use of time series data obtained from remote sensors for vegetation monitoring. Systematization of this collection in a database will provide an overview with which to identify the background, knowledge gaps and trends of the current research.
MATERIALS AND METHODS
A search of scientific papers exploring the topic of "monitoring of vegetation using time series data" was carried out using the Web of Science website (http:// apps.webofknowledge.com). A database of published papers was constructed containing the following information fields: reference, year of publication, paper title, journal, impact factor, source of funding, spatialized (mapped) results, number of authors, number of institutions involved, study objective, area of influence, country, size and location of the study area, vegetation and land use, climate, platform/sensor, number of sensors used, spatial resolution, number of images analyzed, years analyzed, main data, ancillary data, software, main algorithms used and purpose of algorithm and variables of interest. The data were subsequently grouped into ranges and categories of similar data in order to facilitate their representation and statistical description.
The papers were classified into two groups: those using one sensor and those presenting a combination of two or more sensors (e.g. Landsat sensors and SPOT sensors combination, Landsat sensors and Sentinel sensors combination, among others). A means test (Kruskal-Wallis test, p ≤ 0.05) was performed in R Studio (2013) between these groups in order to identify which group featured the most robust time series (more years analyzed). To ensure coherence of the results in this review, opinions were sought from experts.
RESULTS
Temporal trend
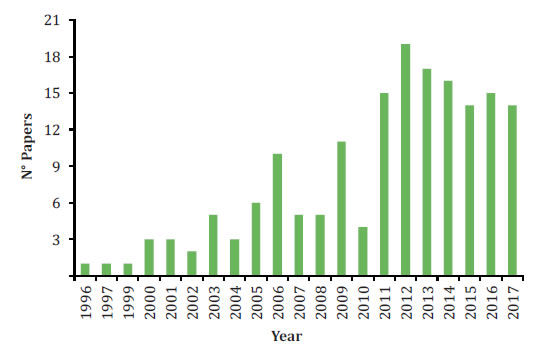
Initially, 186 papers were detected by the search, of which 167 were chosen for analysis (see supplementary material). Studies of all types of vegetation and climate were included. The rest of papers did not study vegetation, and some articles even belonged to other branches of science. The 167 papers analyzed were published in the period 1996 to 2017 (August). No papers were found for the year 1998, and the highest number of papers on the study topic was published in 2012. Three periods of research output productivity were identified: the first was observed during the period 1996-2002, with an average of 1 to 3 papers published per year; the second covered the period 2003-2010, with an average of 3 to 10 papers published per year; and the third was identified for the period 2011-2017, with an average of 11 to 18 papers. This revealed a clear and increasing trend in the number of papers published per year from 1996 to 2017 (figure 1, page 178).

Figure 1. Number of papers/studies grouped by year of publication in vegetation monitoring using time series data (167 papers consulted).
Figura 1. Número de investigaciones/estudios agrupados por año de publicación en el monitoreo de vegetación usando datos de series de tiempo (167 documentos consultados).
Most preferred journal for publication
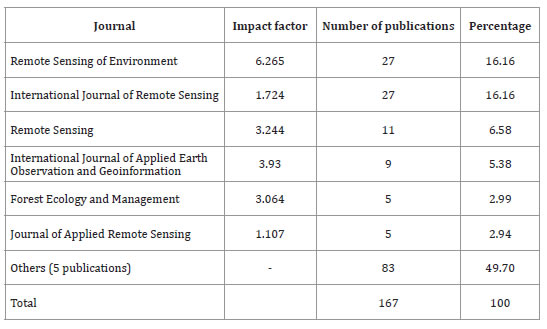
The published papers were mainly distributed among 70 journals, where the lowest impact factor was 0.2442 for the "Iranian Journal of Science & Technology", and the highest was 8.502 for the journal "Global Change Biology". In addition, there were journals that were prominent in terms of quantity of publications (table 1, page 179).
Table 1. Journals with highest number of publications in vegetation monitoring using time series data (167 papers consulted).
Tabla 1. Revistas con más publicaciones en el monitoreo de vegetación usando datos de series de tiempo (167 artículos consultados).
Papers published per country
While time series data analysis for monitoring vegetation has been conducted practically worldwide, China and Brazil are the prominent countries in terms of the number of studies published (figure 2, page 179).
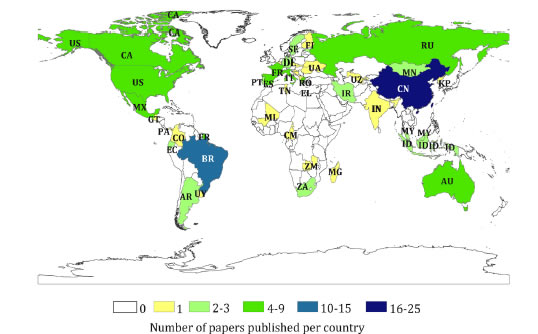
Figure 2. Global studies published in the field of vegetation monitoring using time series data, grouped by country (167 papers consulted).
Figura 2. Estudios publicados a nivel global en el campo del monitoreo de vegetación usando datos de series de tiempo, agrupados por país (167 documentos consultados).
Most studied ecosystems
The main ecosystems studied, as well as the main types of climate that occur in the data analyzed, are shown in figure 3 (page 180).
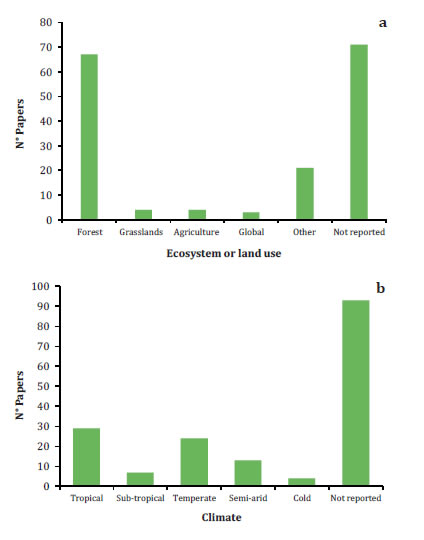
Figure 3. Papers published on vegetation monitoring using time series data, grouped by type of ecosystem (a) and by type of climate (b), from a total of 167 papers analyzed.
Figura 3. Documentos publicados sobre el monitoreo de la vegetación usando datos de series de tiempo, agrupados por tipo de ecosistema (a) y por tipo de clima (b) estudiado, 167 artículos analizados.
It should be noted that the main ecosystem and climate studied worldwide are forests and the tropical climate, respectively.
Most used approach/methodology
The main methodologies found are based on classification of plant cover and monitoring of phenological states. Most of these methods use the vegetation index NDVI as the main element. These, in combination with other algorithms, help the extraction of results. An interesting aspect found was that the research mostly utilized climatic information as ancillary data. In table 2 (page 181), vegetation monitoring is summarized.
Table 2. Main algorithms/indexes and approaches for vegetation monitoring using time series data.
Tabla 2. Principales algoritmos/índices y enfoques para el monitoreo de la vegetación usando datos de series de tiempo.
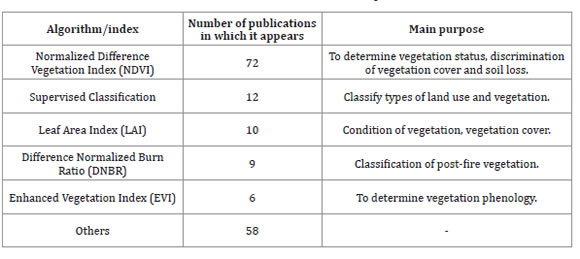
The NDVI is the most reported algorithm in the literature.
Sensors used
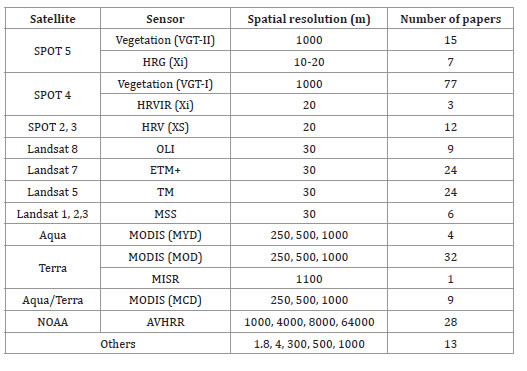
The most used satellites were SPOT, followed by Landsat, although it should be noted that a combination of data from several different satellites is used in some studies (table 3, page 181).
Table 3. Most used satellites/sensors in published papers addressing vegetation monitoring using time series data (167 papers consulted).
Tabla 3. Satélites/sensores más utilizados en artículos publicados sobre el monitoreo de la vegetación utilizando datos de series de tiempo (167 documentos consultados).
It was also found that most of the studies featured analysis of periods from 1 to 10 years, while only one study analyzed a period of more than 40 years (110 years) (figure 4).
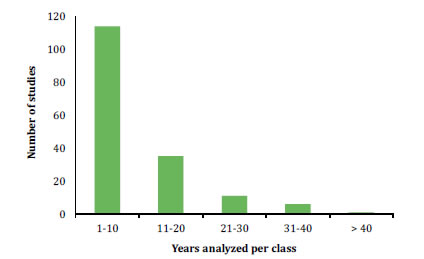
Figure 4. Number of papers grouped by the category of number of years of remotely sensed time series data used for vegetation monitoring.
Figura 4. Número de artículos agrupados por la categoría de años de datos de series temporales de teledetección utilizados para el monitoreo de la vegetación.
Specifically, the most analyzed period was from 2000 to 2010 (figure 5) since it was observed that the time series studies mainly analyzed the period from the year 1980 to date.
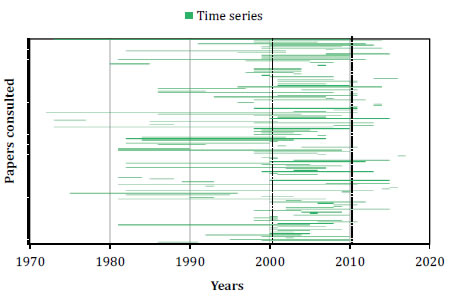
Figure 5. Starting and ending years of the time series data analyzed in vegetation monitoring studies (167 papers consulted, the period between the dotted vertical line denotes the most commonly analyzed period of time).
Figura 5. Año de inicio y final de las series de tiempo analizadas en estudios de monitoreo de la vegetación (167 documentos consultados, el período entre la línea vertical punteada indica el período de tiempo más analizado).
The reviewed papers and the opinions of experts indicate that, in recent years, the combination of data (image fusion) from different sensors (e.g. Landsat sensors and SPOT sensors combination, Landsat sensors and Sentinel sensors combination, among others) has served to improve its quality (45) and therefore deserves special attention. Our results indicated that 77 of 167 articles used combinations of several sensors. These papers have mostly been published in the last decade, thus representing a current trend in the analysis of time series data.
No significant difference was found between the average of the number of years analyzed using only one sensor (8.18 years) and that using a combination of several sensors (8.4 years) (significance of 0.05) (figure 6).
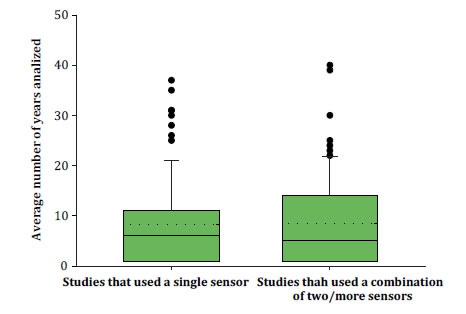
Figure 6. Comparison of the number of years of vegetation monitoring analyzed using time series data, performed with a single sensor or with a combination of several sensors. Total of 167 papers analyzed.
Figura 6. Comparación del número de años de monitoreo de vegetación analizados utilizando datos de series de tiempo, realizados con un solo sensor y con una combinación de varios sensores, 167 artículos analizados.
DISCUSSION
Our study reveals some important trends found in vegetation monitoring studies using time series data over the period 1996-2017 (August). The number of vegetation monitoring papers published using time series data has shown a considerable increase over the last 7 years of this period. This supports that reported by Zhuang et al. (2013), who also found a significant increase in the number of papers published in recent decades in the field of remote sensing. This pattern is due to the fact that remote sensing is a rapidly advancing technology and has in recent years experienced unprecedented growth due to the development of sensors and increased information technology capacities, including processing, storage and data base formation (30).
The journals that published the greatest number of papers in the field of vegetation monitoring using time series data were Remote Sensing of Environment and International Journal of Remote Sensing. Likewise, Zhuang et al. (2013) reported that these two journals are among those with the most papers published in the field of remote sensing over recent years. In terms of the geographic location of scientific production, China and Brazil are the leaders in this field (48). These two countries are in the group of 20 countries with the highest scientific production (published papers) in the field of remote sensing. Indeed, China is the second most productive country in the world, after the United States (48).
The most studied ecosystem is forest, followed by grassland and then by general global monitoring of vegetation. This is logical, since forests are the most widely distributed ecosystems on the planet (42). However, it should be noted that the study of other ecosystems is also of great importance.
Of the 167 papers reviewed, the methodologies used for vegetation monitoring most commonly featured the Normalized Difference Vegetation Index (NDVI). The NDVI, developed by Rouse et al. (1974), stands out in that, since its appearance, it has quickly become the most dominant satellite observable metric for spatio-temporal changes (18) and has been successfully used to explore vegetation dynamics (20), although in recent years there has also been an attempt to improve and evaluate the performance of algorithms and indices to improve vegetation monitoring (35). Some notable studies were also found, using a considerable number of indices (6, 11, 19, 23).
A further important factor in vegetation monitoring using time series data, is that of the satellites utilized. Landsat satellites are the most commonly used in remote sensing; however, in the analyzed data, SPOT satellites appear as the most used in multi-temporal studies. This could be explained by some limitations of Landsat, (e.g. temporal resolution or images contaminated by cloud and shadow) (12). For this reason, the suite of SPOT sensors is the most widely used alternative to Landsat (32) and some authors state that it is particularly suitable for vegetation mapping at global and regional scales (44). With regards to Landsat, it should be noted that most studies that use Landsat data correspond to more recent years, since initiation of the free and open Landsat data policy in 2008 (47). This is therefore a satellite of great potential for the future given its availability (i.e. free and open access). In recent decades, the cost of data storage has dramatically decreased, providing a viable basis for time series analysis that demands Landsat data (46).
Most studies have analyzed time series of between 1 and 10 years. However, since 2010, more complex investigations have been carried out. This could also be strongly influenced by the free access policies of Landsat, as mentioned above, as well as the launch of the MODIS sensor onboard the Aqua/ Terra satellites notable for its temporal resolution (28). Remote sensing is a rapidly advancing technology (40) and has now reached a price point where the images acquired by these systems are truly accessible (36).
New trends for the analysis of time series data
Advances in remote sensing technology, in terms of software, processes and information acquisition, mean that it is now possible to conduct research with data from several different sensors (2, 15, 24, 29, 31). While this could in theory produce more robust time series, statistical testing shows that there is no significant difference between time series analyzed with data from a single sensor and those analyzed with a combination of data from several sensors. Nevertheless, the combination of data (image fusion) improves the quality of the results (13) since this technique can integrate different image data and provide more information than the derived from a single sensor (39).
In this sense, K. de Beurs (personal communication, February 16, 2018) indicates that special attention should be given to the use of fusion of optical and radar data, since this offers more unique spectral and structural information for land cover and land use assessments. This coincides with Joshi et al. (2016), who indicate that future research should focus on the development of robust optical and radar data fusion techniques, including those that test the frequency with which time series and variable spatial resolution data sets can be combined in a significant manner with a minimum loss of information.
The main difference between these types of data is that, compared to optical satellite images, synthetic aperture radars (SARs) have certain advantages for vegetation monitoring due to the fact that microwave sensors have longer wavelengths, can penetrate vegetation canopies, and are not influenced by the presence of clouds or haze (16, 17). Some SARs have a short revisit time and high spatial resolution, which could be beneficial for vegetation monitoring. Since optical and SAR image data respond to crop characteristics differently, their complementary information can be valuable to support vegetation monitoring (39).
Another aspect of great interest, at present and for the future, is the use of free access data and software. According to Wulder et al. (2012), open access to data promotes greater international collaboration to meet the land observation needs of the twenty-first century. In this sense, the Landsat satellite network stands out for both the long history and free access of its data set (25). It is also important to mention the establishment of a Landsat-9 Architecture Study Team that define capabilities and implementation strategy. Landsat-9 has been authorized and is proceeding towards a December 2020 launch. Planning for missions beyond Landsat-9 is also underway, with the USGS defining future Landsat measurement needs (e.g., Landsat-10 and -11) (43).
While the ability to use a multitude of images acquired in a single region has changed the perception on the Landsat value, some properties of this satellite are currently critical (41). One limitation of Landsat is that the satellites can only revisit the same area every 16 days, and the acquired Landsat data for specific areas can be contaminated by cloud and shadow. The temporally sparse time-series Landsat data are, therefore, unsuitable for global monitoring of rapid changes in the vegetation and terrestrial surface (12).
A potential approach for utilization of Landsat data is represented by data fusion techniques that integrate imagery across sensors, effectively leveraging the most desirable characteristics from multiple sensors. The spatial, spectral and temporal resolution of any given sensor can thus potentially be enhanced by merging bands within or across sensors (32).
Special attention should also be paid to the Sentinel-2 satellite since, in terms of spatial and temporal resolution, it provides an alternative to SPOT and Landsat, with narrower bands for better identification of characteristics, additional channels in the red edge spectral domain that allow evaluation of vegetation status and specific bands for improved atmospheric correction (10, 27). There has even been experimentation with the fusion of Landsat and Sentinel-2 satellite data, showing great potential for timely monitoring of rapid changes (38). Currently, the Harmonized Landsat/ Sentinel-2 (HLS) project provides a surface reflectance product that combines observations from USGS/NASA's Landsat 8 and ESA's Sentinel-2 satellites at moderate spatial resolution (30 m). The main goal is to provide a unique dataset based on the data of both satellites in order to reduce the revisit time to 3-5 days, depending on latitude (8).
CONCLUSIONS
Most of the articles analyzed (64.7%) were published in the last 7 years of the study period, reflecting the great changes that remote sensing has undergone in terms of data availability. China and Brazil are the countries with the highest number of vegetation monitoring studies using time series data. The main ecosystems studied are the forests, although in recent years it is common to find studies of vegetation monitoring at the global scale.
The SPOT satellites have been the most used for vegetation monitoring using time series data, but Landsat satellites aim to be the most popular in the future due to the availability, periodicity and easy handling of its data. Also important is the Sentinel-2 satellite, which is notable for its greater temporal resolution.
On average, the number of years analyzed with time series data was similar using either a single sensor or a combination of different sensors. However the combination of data from different sensors (image fusion) can improve results quality, while the use of fusion of optical and radar data points towards a new trend in this field.
Our findings in this review of literature on vegetation monitoring using time series data will contribute to future work in this field, improving decision-making about periods for analysis and appropriate data selection from remote sensors.
Supplementary Material
h t t p s : / / d r i v e . g o o g l e . c o m / open?id=1bMilH96d1E--7PLI1VhwkzIFXpT3Z4GL
1. Albornoz, L.; Rodríguez Plaza, L.; Navarro, A.; López, M.; Bageta, C.; Mercado, L. 2019. Vineyard zoning of cv Bonarda argentine (Vitis vinífera L.), from Sentinel satellite images and three vegetation indexes. Revista de la Facultad de Ciencias Agrarias. Universidad Nacional de Cuyo. Mendoza. Argentina. 51(2): 167-176.
2. Arino, O.; Casadio, S.; Serpe, D. 2012. Global night-time fire season timing and fire count trends using the ATSR instrument series. Remote Sensing of Environment. 116: 226-238.
3. Baeza, S.; Baldassini, P.; Bagnato, C.; Pinto, P.; Paruelo, J. 2014. Caracterización del uso/cobertura del suelo en Uruguay a partir de series temporales de imágenes MODIS. Agrociencia Uruguay. 18(2): 95-105.
4. Banskota, A.; Kayastha, N.; Falkowski, M. J.; Wulder, M. A.; Froese, R. E.; White, J. C. 2014. Forest monitoring using Landsat time series data: A review. Canadian Journal of Remote Sensing. 40(5): 362-384.
5. Camps-Valls, G.; Tuia, D.; Bruzzone, L.; Benediktsson, J. A. 2014. Advances in hyperspectral image classification: Earth monitoring with statistical learning methods. IEEE Signal Processing Magazine. 31(1): 45-54.
6. Chen, B.; Cao, J.; Wang, J.; Wu, Z.; Tao, Z.; Chen, J.; Yang, C.; Xie, G. 2012. Estimation of rubber stand age in typhoon and chilling injury afflicted area with Landsat TM data: a case study in Hainan Island, China. Forest Ecology and Management. 274: 222-230.
7. Chen, J.; Chen, J.; Liao, A.; Cao, X.; Chen, L.; Chen, X.; Chaoying, H.; Gang, H.; Shu, P.; Miao, L.; Weiwei, Z.; Xiaohua, T.; Jon, M. 2015. Global land cover mapping at 30 m resolution: A POK-based operational approach. ISPRS Journal of Photogrammetry and Remote Sensing. 103: 7-27.
8. Claverie, M.; Ju, J.; Masek, J. G.; Dungan, J. L.; Vermote, E. F.; Roger, J.-C.; Skakun, S. V; Justice, C. 2018. The Harmonized Landsat and Sentinel-2 surface reflectance data set. Remote Sens. Environ. 219: 145-161.
9. Di Bella, C. M.; Beget, M. E.; Campos, A. N.; Viglizzo, E.; Jobbágy, E.; García, A. G.; Sycz, A.; Cotroneo, C. 2019. Changes in vegetation seasonality and livestock stocking rate in La Pampa Province (Argentina). Revista de la Facultad de Ciencias Agrarias. Universidad Nacional de Cuyo. Mendoza. Argentina. 51(1): 79-92.
10. Drusch, M.; Del Bello, U.; Carlier, S.; Colin, O.; Fernandez, V.; Gascon, F.; Hoersch, B.; Isola, C.; Laberinti, P.; Martimort, P.; Meygret, A.; Spoto, F.; Sy, O.; Marchese, F.; Bargellini, P. 2012. Sentinel-2: ESA's optical high-resolution mission for GMES operational services. Remote Sensing of Environment. 120: 25-36.
11. Einzmann, K.; Immitzer, M.; Böck, S.; Bauer, O.; Schmitt, A.; Atzberger, C. 2017. Windthrow detection in European forests with very high-resolution optical data. Forests. 8(1): 21.
12. Gao, F.; Hilker, T.; Zhu, X.; Anderson, M.; Masek, J.; Wang, P.; Yang, Y. 2015. Fusing Landsat and MODIS data for vegetation monitoring. IEEE Geoscience and Remote Sensing Magazine. 3(3): 47-60.
13. Ghassemian, H. 2016. A review of remote sensing image fusion methods. Information Fusion. 32: 75-89.
14. Gómez, C.; White, J. C.; Wulder, M. A. 2016. Optical remotely sensed time series data for land cover classification: A review. ISPRS Journal of Photogrammetry and Remote Sensing. 116: 55-72.
15. Hardtke, L. A.; Blanco, P. D.; del Valle, H. F.; Metternicht, G. I.; Sione, W. F. 2015. Semi-automated mapping of burned areas in semi-arid ecosystems using MODIS time-series imagery. International Journal of Applied Earth Observation and Geoinformation. 38: 25-35.
16. Herold, N. D.; Haack, B. N. 2002. Fusion of radar and optical data for land cover mapping. Geocarto International. 17(2): 21-30.
17. Herold, N. D.; Haack, B. N. 2006. Comparison and integration of radar and optical data for land use/cover mapping. Geocarto International. 21(4): 9-19.
18. Houborg, R.; Fisher, J. B.; Skidmore, A. K. 2015. Advances in remote sensing of vegetation function and traits. International Journal of Applied Earth Observation and Geoinformation.1-6.
19. Huang, H.; Roy, D. P.; Boschetti, L.; Zhang, H. K.; Yan, L.; Kumar, S. S.; Gomez-Dans J.; Li, J. 2016. Separability analysis of Sentinel-2A multi-spectral instrument (MSI) data for burned area discrimination. Remote Sensing. 8(10): 873.
20. Hutchinson, J. M. S.; Jacquin, A.; Hutchinson, S. L.; Verbesselt, J. 2015. Monitoring vegetation change and dynamics on US Army training lands using satellite image time series analysis. Journal of Environmental Management. 150: 355-366.
21. Joshi, N.; Baumann, M.; Ehammer, A.; Fensholt, R.; Grogan, K.; Hostert, P.; Jepsen, M. R.; Kuemmerle, T.; Meyfroidt, P.; Mitchard, E. T. A.; Reiche, J.; Ryan, C.; Waske, B. 2016. A review of the application of optical and radar remote sensing data fusion to land use mapping and monitoring. Remote Sensing. 8(1): 70.
22. Khatami, R.; Mountrakis, G.; Stehman, S. V. 2016. A meta-analysis of remote sensing research on supervised pixel-based land-cover image classification processes: General guidelines for practitioners and future research. Remote Sensing of Environment. 177: 89-100.
23. Kim, J.; Grunwald, S.; Rivero, R. G.; Robbins, R. 2012. Multi-scale modeling of soil series using remote sensing in a wetland ecosystem. Soil Science Society of America Journal. 76(6): 2327-2341.
24. Kim, Y.; Huete, A. R.; Miura, T.; Jiang, Z. 2010. Spectral compatibility of vegetation indices across sensors: band decomposition analysis with Hyperion data. Journal of Applied Remote Sensing. 4(1): 043520.
25. Loveland, T. R.; Dwyer, J. L. 2012. Landsat: Building a strong future. Remote Sensing of Environment. 122: 22-29.
26. Malhi, Y.; Phillips, O. L.; Lloyd, J.; Baker, T.; Wright, J.; Almeida, S.; Arroyo, l.; Frederiksen, T.; Grace, J.; Higuchi, N.; Killeen, T.; Laurance, W. F.; Leaño, C.; Lewis, S.; Meir, P.; Monteagudo, A.; Neill, D.; Núñez-Vargas, P.; Panfil, S. N.; Patiño, S.; Pitman, N.; Quesada, C. A.; Rudas‐Ll, A.; Salomão, R.; Saleska, S.; Silva, N.; Silveira, M.; Sombroek, W. G.; Valencia, R.; Vásquez- Martínez, R.; Vieira, I. C.; Vinceti, B. 2002. An international network to monitor the structure, composition and dynamics of Amazonian forests (RAINFOR). Journal of Vegetation Science. 13(3): 439-450.
27. Martimor, P.; Arino, O.; Berger, M.; Biasutti, R.; Carnicero, B.; Del Bello, U.; Fernandez, V.; Gascon, F.; Silvestrin, P.; Sy, O. 2007. Sentinel-2 optical high-resolution mission for GMES operational services. In Geoscience and Remote Sensing Symposium. IGARSS 2007. IEEE International. 2677-2680.
28. National Aeronautics and Space Administration (NASA). (2019). Moderate Resolution Imaging Spectroradiometer (MODIS). Available online: https://modis.gsfc.nasa.gov/about/ components.php (Accessed on May 24, 2019).
29. Nyamugama, A.; Kakembo, V. 2015. Estimation and monitoring of aboveground carbon stocks using spatial technology. South African Journal of Science. 111(9-10): 01-07.
30. Pajares, G. 2015. Overview and current status of remote sensing applications based on unmanned aerial vehicles (UAVs). Photogrammetric Engineering & Remote Sensing. 81(4): 281-329.
31. Pickett-Heaps, C. A.; Canadell, J. G.; Briggs, P. R.; Gobron, N.; Haverd, V.; Paget, M. J.; Pinty, B.; Raupach, M. R. 2014. Evaluation of six satellite-derived Fraction of Absorbed Photosynthetic Active Radiation (FAPAR) products across the Australian continent. Remote Sensing of Environment. 140: 241-256.
32. Powell, S. L.; Pflugmacher, D.; Kirschbaum, A. A.; Kim, Y.; Cohen, W. B. 2007. Moderate resolution remote sensing alternatives: a review of Landsat-like sensors and their applications. Journal of Applied Remote Sensing. 1(1): 012506.
33. R Development Core Team. 2013. R: A Language and Environment for Statistical Computing. R Foundation for Statistical Computing, Vienna, Austria.
34. Rouse, Jr. J.; Haas, R. H.; Schell, J. A.; Deering, D. W. 1974. Monitoring vegetation systems in the Great Plains with ERTS. In Third Earth Resources Technology Satellite (ERTS) symposium. Washington. DC: NASA. 309-317.
35. Schultz, M.; Clevers, J. G.; Carter, S.; Verbesselt, J.; Avitabile, V.; Quang, H. V.; Herold, M. 2016. Performance of vegetation indices from Landsat time series in deforestation monitoring. International Journal of Applied Earth Observation and Geoinformation. 52: 318-327.
36. Toth, C.; Jóźków, G. 2016. Remote sensing platforms and sensors: A survey. ISPRS Journal of Photogrammetry and Remote Sensing. 115: 22-36.
37. Volante, J.; Mosciaro, J.; Morales, P. M.; Vale, L.; Castrillo, S.; Sawchik, J.; Tiscorna, G.; Fuente, M.; Maldonado, I.; Vega, A.; Trujillo, R.; Cortéz, L.; Paruelo, J. 2015. Expansión agrícola en Argentina, Bolivia, Paraguay, Uruguay y Chile entre 2000-2010. Caracterización espacial mediante series temporales de índices de vegetación. Revista de Investigaciones Agropecuarias. 41(2): 1.
38. Wang, Q.; Blackburn, G. A.; Onojeghuo, A. O.; Dash, J.; Zhou, L.; Zhang, Y.; Atkinson, P. M. 2017. Fusion of Landsat 8 OLI and Sentinel-2 MSI data. IEEE Transactions on Geoscience and Remote Sensing. 55(7): 3885-3899.
39. Wang, X. L.; Chen, C. X. 2016. Image fusion for synthetic aperture radar and multispectral images based on sub-band-modulated non-subsampled contourlet transform and pulse coupled neural network methods. The Imaging Science Journal. 64(2): 87-93.
40. Watts, A. C.; Ambrosia, V. G.; Hinkley, E. A. 2012. Unmanned aircraft systems in remote sensing and scientific research: Classification and considerations of use. Remote Sensing. 4(6): 1671-1692.
41. Wulder, M. A.; Masek, J. G.; Cohen, W. B.; Loveland, T. R.; Woodcock, C. E. 2012. Opening the archive: How free data has enabled the science and monitoring promise of Landsat. Remote Sensing of Environment. 122: 2-10.
42. Wulder, M. A.; Coops, N. C. 2014. Make Earth observations open access. Nature. 7516 (513): 30-31. doi: http://dx.doi.org/10.1038/513030a
43. Wulder, M. A.; Loveland, T. R.; Roy, D. P.; Crawford, C. J.; Masek, J. G.; Woodcock, C. E.; Allen, R. G.; Anderson, M. C.; Belward, A. S.; Cohen, W. B.; Dwyer, J.; Erb, A.; Gao, F.; Griffiths, P.; Helder, D.; Hermosilla, T.; Hipple, J. D.; Hostert, P.; Hughes, M. J.; Huntington, J.; Johnson, D. M.; Kennedy, R.; Kilic, A.; Li, Z.; Lymburner, L.; McCorkel, J.; Pahlevan, N.; Scambos, T. A.; Schaaf, C.; Schott, J. R.; Sheng, Y.; Storey, J.; Vermote, E.; Vogelmann, J.; White, J. C.; Wynne, R. H.; Zhu, Z. 2019. Current status of Landsat program, science, and applications. Remote Sensing of Environment. 225: 127-147.
44. Xie, Y.; Sha, Z.; Yu, M. 2008. Remote sensing imagery in vegetation mapping: a review. Journal of Plant Ecology. 1(1): 9-23.
45. Zhang, J. 2010. Multi-source remote sensing data fusion: status and trends. International Journal of Image and Data Fusion. 1(1): 5-24.
46. Zhu, Z. 2017. Change detection using landsat time series: A review of frequencies, preprocessing, algorithms, and applications. ISPRS Journal of Photogrammetry and Remote Sensing. 130: 370-384.
47. Zhu, Z.; Wulder, M. A.; Roy, D. P.; Woodcock, C. E.; Hansen, M. C.; Radeloff, V. C.; Healey, S.; Schaaf, C.; Hostert, P.; Strobl, P.; Pekel, J. F.; Lymburner, L.; Pahlevan, N.; Scambos, T. A. 2019. Benefits of the free and open Landsat data policy. Remote Sensing of Environment. 224: 382-385.
48. Zhuang, Y.; Liu, X.; Nguyen, T.; He, Q.; Hong, S. 2013. Global remote sensing research trends during 1991-2010: a bibliometric analysis. Scientometrics. 96(1): 203-219.