ORIGINAL ARTICLE
SSR markers linked to stem canker resistance in soybean (Glycine max)
Marcadores SSRs ligados a la resistencia al cancro del tallo en soja (Glycine max)
Javier Ramón Gilli 1*, Gabriel Ricardo Vellicce 2, Clarisa Noelia Bernardi 1
1 EEA INTA Marcos Juárez. Laboratorio de Biotecnología. Ruta provincial N° 12. km 2. C.P. 2580. Marcos Juárez. Córdoba. Argentina. * gilli.javier@inta.gob.ar
2 Estación Experimental Agroindustrial Obispo Colombres (EEAOC). Consejo Nacional de Investigaciones Científicas y Técnicas (CONICET). Instituto de Tecnología Agroindustrial del Noroeste Argentino (ITANOA). Av. William Cross 3150. C. P. T4101XAC. Las Talitas. Tucumán. Argentina.
Originales: Recepción: 28/09/2018 - Aceptación: 14/09/2019
ABSTRACT
This work studied 40 samples of Diaporthe phaseolorum var. meridionalis (Dpm), causal agent of stem canker in soybeans (SCS). In the susceptible genotype Golondrina65, the isolate RSF12 showed the highest percentage of dead plant index (DP = 85.7 %) and was used to characterize all known sources of resistance to Dpm. The soybean MJ19RR experimental line showed, the best behaviour against this isolate with a DP = 2.4 % and was used to develop a segregating population with the susceptible cultivar FT-2001. In the F2 generation, a chi-square test determined a 3:1 ratio of resistant plants against susceptible plants, as expected for a dominant gene. In order to advance in our study, we proposed as objective, to map the resistance to Diaporthe phaseolorum var. meridionalis. The Bulked Segregant Analyses and the genetic linkage study identified a region on chromosome 6 of the genetic map of soybean, located at 13.3 cM from the Satt433 locus associated with resistance to SCS. The soybean experimental line MJ19RR was selected as the best source of resistance, available in the active bank of soybean germplasm of INTA, for the genetic control of this disease. The results obtained in this work represent a first approximation for the understanding of the genetic basis of resistance to SCS.
Keywords: Diaporthe phaseolorum var. meridionalis; Molecular markers; Fungal resistance; Glycine max
RESUMEN
En este trabajo estudiamos 40 muestras de Diaporthe phaseolorum var. meridionalis (Dpm), agente causal del cancro del tallo en soja (CTS). En el control susceptible Golondrina65, el aislado RSF12 presentó el mayor porcentaje del índice de plantas muertas (DP = 85,7 %) y fue utilizado para caracterizar las fuentes de resistencia conocidas al Dpm. La línea experimental de soja MJ19RR mostró el mejor comportamiento frente a este aislado, con un valor de DP= 2,4 %, y fue utilizada para desarrollar una población segregante con el cultivar susceptible FT-2001. En la generación F2 la prueba de chi-cuadrado determinó una proporción 3:1 de plantas resistentes versus plantas susceptibles, como se espera para un gen dominante. Para avanzar en nuestro estudio, proponemos como objetivo localizar en el mapa genético de soja la resistencia a Diaporthe phaseolorum var. meridionalis. El Bulked Segregant Analyses y el estudio de ligamiento genético identificaron una región del cromosoma 6 del mapa genético de soja, a 13,3 cM del locus Satt433, asociada a la resistencia al CTS. Además la línea experimental de soja MJ19RR fue seleccionada como la mejor fuente de resistencia disponible en el banco activo de germoplasma de soja de INTA para el control genético de esta enfermedad. Los resultados obtenidos en este trabajo representan una primera aproximación para la comprensión de las bases genéticas de la resistencia al CTS.
Palabras claves: Diaporthe phaseolorum var. meridionalis; Marcadores moleculares; Resistencia a hongos; Glycine max
INTRODUCTION
Soybean stem canker (SSC) is caused by Diaporthe phaseolorum. First reported in USA in 1940s, it was one of the pathogens with major impact on soybean yield. A variant named meridionalis was identified in 1973 in southern USA with two different stages: the asexual one as Phomopsis phaseoli var. meridionalis in infected plant tissue, and the sexual phase, as Diaporthe phaseolorum var. meridionalis (Dpm) on plant detritus (14). In Argentina, D. phaseolorum v ar. meridionalis was first reported in 1992 (7). It is currently distributed all over the soybean production areas with four different physiological breeds identified according to response to inoculation of different resistant cultivars (10).
SSC resistance is controlled by five major, dominant, nonallelic genes: Rdm1 and Rdm2 in cv. Tracy-M (11); Rdm3 in cv. Crockett, Rdm4 in cv. Dowling and cv. Hutcheson (2, 3) and Rdm5 in cv. Hutcheson (20). The pyramiding of these resistance genes could be the better strategy for achieving control of all physiological breeds causing SSC. In this sense, marker assisted selection is a tool that is currently available in most breeding programs, however information about mapped markers associated with resistance to SSC is scarse.
With the objective of locating the genetic resistance to Diaporthe phaseolorum var. meridionalis in the genetic soybean map, it was used a Bulked Segregant Analysis (BSA) strategy (13) was used in a F2 population derived from a simple cross between the MJ19RR x FT-2001 genotypes.
BSA is a simple strategy used as first approach to locate genomic regions associated with important agronomic traits. It is based on segregation disequilibrium caused by genetic linkage and consists in of comparing two DNA bulks from plants of a segregating population (generation F2) derived from a simple cross or a backcross (generation BC1F2).
MATERIALS AND METHODS
Fungal isolation
D. phaseolorum var. meridionalis were obtained from infected plants showing typical SSC symptoms from soybean production fields located in Córdoba and Santa Fe regions of Argentina, during the 2013/2014 harvest season. Isolation was conducted by the method of Keeling (9). D. phaseolorum var. meridionalis were cultivated on potato dextrose agar (PDA) plates at 27 ± 2°C for 5 days, and then maintained at room temperature for 45 days in order to induce perithecium fructification. Afterwards, the cultures were maintained at 4°C. Morphologic characterization considered the aspect of the colony, the perithecium, the pycnidium and whether α or β conidia were present (5). Isolates fitting to D. phaseolorum var. meridionalis description were subcultured on new PDA media. Finally virulence studies of each isolate were performed by inoculation of the susceptible control Golondrina65 under greenhouse conditions.
Plant Materials
The chosen genotypes included: the susceptible control Golondrina65 and the cultivars Tracy-M, Crockett, Dowling, Hutcheson, MJ19RR, Hartwig, Pickett71, FT-2001 and Peking. In addition, 147 F2 plants were obtained after crossing the contrasting parents FT-2001 (susceptible) and MJ19RR (resistant). This cross was performed in INTA Marcos Juarez in January 2015, 147 F2 seeds were obtained from a single F1 plant.
Phenotypic screening
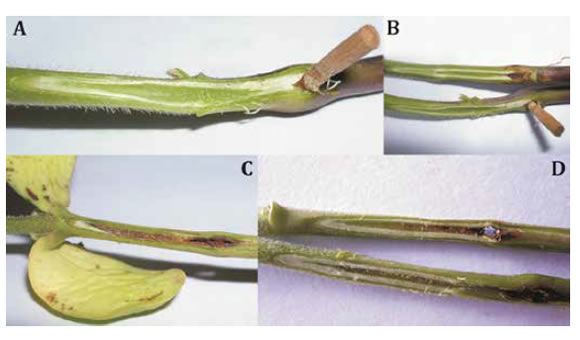
The toothpick method (9) was chosen to screen response to SSC under greenhouse conditions. For rating resistance of cultivars against SSC, a random blocks design was used with three replications of 15 plants each. In order to rate the 147 F2 plants, a complete randomized design was performed. Three replicates with 15 Golondrina65 plants randomly distributed, of Golondrina65 were included as positive controls to the inoculation. Seven days after emergence, plants were inoculated with Dpm mycelium and kept at a 25-30°C temperature with 100% of relative humidity (RH) for 48 h. Subsequently, the plants were maintained in a greenhouse for 25 days before rate disease severity was recorded. A longitudinal section of the stem was taken to measure pathogen penetration into plant tissue (photo 1, page 29).

Photo 1. Reaction of soybean genotypes 25 days after inoculation with D. phaseolorum var meridionalis. A and B, resistant reaction in MJ19RR; C and D, susceptible reaction in FT-2001, showing necrosis caused by fungal growth on hypocotyl plant.
Foto 1. Reacción de genotipos de soja luego de 25 días de la inoculación con D. phaseolorum var meridionalis. A y B, reacción de resistencia en MJ19RR. C y D, reacción susceptible en FT-2001, se observa necrosis causada por el hongo en el hipocotilo de las plántulas.
Genotype resistance was rated as the average value of the percentage of dead plants index (% DP) in three replicates using Equation 1:

where:
DP = number of dead plants
IP = number of infected plants
TP = total number of plants
Four levels of disease severity were established to rank cultivars response to Dpm, according to percentage of death plant index (% DP): resistant R = 0 to 14.9%, moderately susceptible MS = 15 to 49.9 %, susceptible S = 50 to 84.9% and highly susceptible HS = 85 to 100% (11), F2 individuals were scored in two levels: as resistant when no disease symptoms had developed, and susceptible when disease symptoms were present (photo 1).
DNA extraction
DNA was purified from leaf tissue (15) and suspended in TE buffer (Tris-HCl 10 mM, EDTA 1 mM pH = 8). The concentration was determined by means of electrophoresis on 0.8% agarose gel and comparison with standard samples. For bulk segregant analysis, equimolar solutions were obtained from 15 resistant plants (resistant bulk: RB), and the 15 susceptible plants (susceptible bulk: SB).
PCR amplification
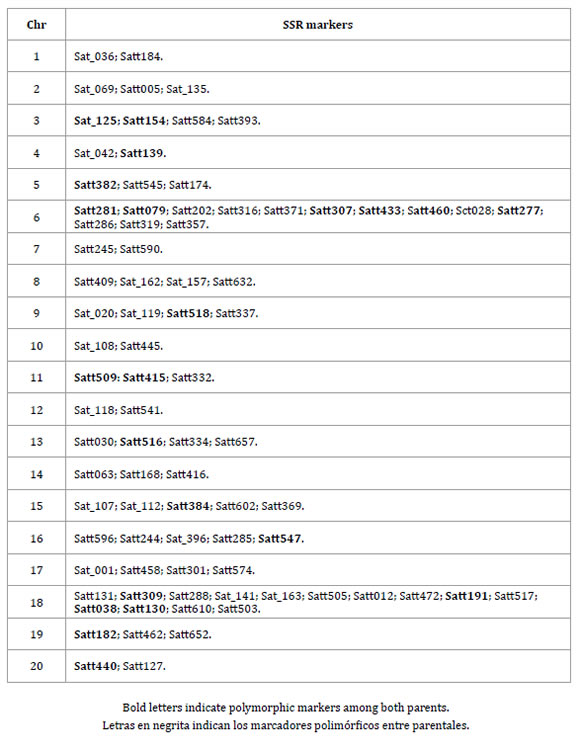
Genetic analysis was performed by PCR amplification of 84 SSR markers covering the 20 chromosomes of the soybean genome (table 1, page 30).
Table 1. Chromosome (Chr) and SSR markers used in the genetic characterization of the parents MJ19RR and FT-2001.
Tabla 1. Cromosomas (Chr) y marcadores SSRs usados en la caracterización de los parentales MJ19RR y FT-2001.
The selection of the SSR was based on the location of the clusters of disease resistance genes previously reported (SoyBase, available in: http://www.soybase.com, accessed, September 2015).
SSR amplification was conducted with a GeneAmp PCR System 9700 (Applied Biosystems, Framingham, MA, USA), using a final volume of 15μl containing 50 ng of DNA of the resistant bulk, the susceptible bulk or the population parents, 1x GoTaq Buffer Green (1.5mM of Cl2Mg), 0.2 mM of each dNTPs, 1U of GoTaq polymerase (PROMEGA, Madison, US), and 0.5 μm of each primer. Amplification conditions were as follows: 94°C for 120 s; 35 cycles of 92°C for 45 s; 47°C for 45 s; 68°C for 45 s; and 68°C for 60 s. PCR products were separated by electrophoresis on 12% polyacrylamide gels, stained with ethidium bromide solution (10 mg/ml) and visualized under UV light. The correct size of amplicons was analyzed by comparison with the reference genotype Williams82 (SoyBase, available in: http:// www.soybase.com, accessed June 2016).
Linkage analysis
Linkage analysis was performed with 147 F2 plants derived from the MJ19RR x FT-2001 cross. Map construction was accomplished with GQMol software (4), using distance unit of Kosambi with 3.0 LOD score and maximum recombination distance of 50 cM. Graphics were obtained with GGT 2.0 software (21).
RESULTS
Fungal isolation
Plants from soybean fields, putatively infected with Dpm were collected. Thirty seven out of 40 samples, produced isolates fitting Dpm description. These were used to inoculate the susceptible control Golondrina65 in order to confirm their identity and measure their virulence on soybean. The isolates that produced % DP values from 80% to 100% were considered highly virulent. The isolate RSF12 obtained in Roman (29°30'49" S, 59°46'40" W), Santa Fe, Argentina, produced the highest % DP values and was selected for further analysis.
Reaction of MJ19RR to RSF12 isolate
The responses of susceptible control Golondrina65 and nine soybean cultivars (Tracy-M, Crockett, Dowling, Hutcheson, MJ19RR, Hartwig, Pickett71, FT-2001, Peking) to inoculation with RSF12 are presented in table 2 (page 32).
Table 2. Percentage of dead plant index (% DP) of soybean genotypes inoculated with isolate RSF12 of Diaporthe phaseolorum var. meridionalis.
Tabla 2. Porcentaje del índice de plantas muertas (% DP) de genotipos de soja inoculados con el aislado RS12 de Diaporthe phaseolorum var. meridionalis.
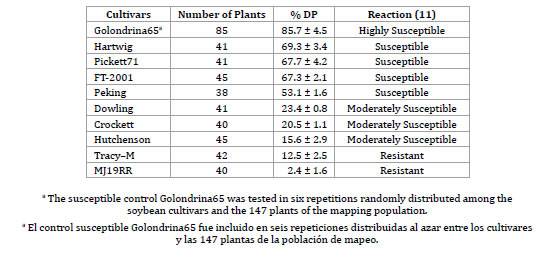
Eighty five plants of Golondrina65 in six replicates were inoculated. All these plants presented typical SSC symptoms corresponding to a highly susceptible reaction (HS) with values % DP of 85.7 ± 4.5. A sub-set of four genotypes produced a susceptible reaction (S) in terms of % DP: Hartwig (69.3 ± 3.4%), Pickett71 (67.7 ± 4.2%), FT-2001 (67.3 ± 2.1%) and Peking (53.1 ± 1.6%), while Dowling, Crockett and Hutcheson produced a moderately susceptible reaction (MS) with % DP values of 23.4 ± 0.8%, 20.5 ± 1.1% and 15.6 ± 2.9%, respectively. On the other hand, Tracy-M and MJ19RR had a resistant reaction (R) with % DP values of 12.5 ± 2.5% and 2.4 ± 1.6%, respectively. It is noteworthy that the MJ19RR was the only genotype that presented no dead plants by inoculation with SSC.
Inheritance of the resistance
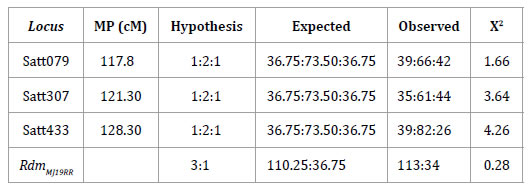
The phenotypic analysis of 147 F2 plants by inoculation with Dpm isolate RSF12 produced 113 and 34 plants showing resistant and susceptible reactions, respectively. The chi-square value χ2 = 0.28 < 3.86 at a p ≤ 0.05 confirmed a 3:1 mendelian segregation that fitted in with a frequency of a single dominant gene (table 3, page 32).
Table 3. Chi-square for the resistance locus RdmMJ19RR and the SSR markers in F2 generation of MJ19RR x FT-2001 and its positions (MP) in the soybean molecular map (19).
Tabla 3. Chi-cuadrado para el locus de resistente RdmMJ19RR y los marcadores SSRs en la generación F2 de MJ19RR x FT-2001 y sus posiciones (MP) en el mapa molecular de soja (19).
Polymorphism detection
All the amplified fragments showed the expected size as reported for the reference genotype Williams 82. Out of all 84 SSR, 22 were polymorphic between the parental cultivars MJ19RR and FT-2001 (table 1, page 30).
In order to detect the SSR that were close to the resistance gene, we considered PCR sensitivity as reported for bulk segregant analysis (13). The markers Satt382 from Chr 5, Satt433 from Chr 6, Satt182 from Chr 19, and Satt152 from Chr 3 were selected as candidates considering low intensity amplification the resistant allele in susceptible bulk (SB) as a sign of low recombination between the markers and the resistance gene.
Mapping SSC resistance in MJ19RR
Out of the four markers (Satt382, Satt433, Satt182 and Satt152) analyzed in the 34 susceptible F2 plants, only in Satt433, the susceptible allele (a band of 200 bp), was observed in 26 of the 34 plants; whereas in the remaining eight plants, the resistant allele (290 bp) was amplified. These latter plants represented recombination events between the marker and the resistance gene (photo 2 and figure 2, page 35).
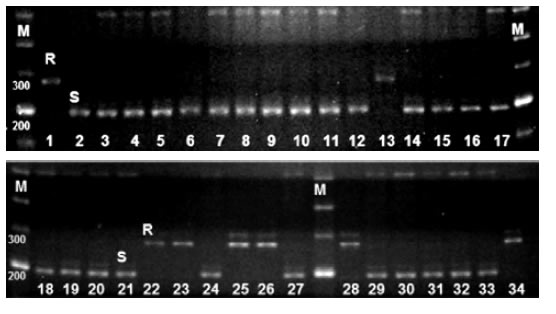
Photo 2. Satt433 amplification in 34 susceptible plants of mapping population. R, resistant allele of MJ19RR, S. susceptible allele of FT-2001. M, molecular weight marker.
Foto 2. Amplificación de Satt433 en las 34 plantas susceptibles de la población de mapeo. R, alelo resistente de MJ19RR; S, alelo susceptible de FT-2001. M, marcador de peso molecular.
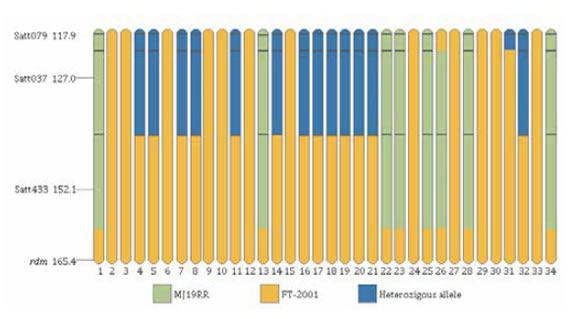
Figure 2. Recombination in distal region of chromosome 6 in 34 susceptible plants of mapping population. Orange fragments denote susceptible allele of FT-2001, green fragments denote the resistant allele of MJ19RR blue fragments, denote heterozygous regions.
Figura 2. Recombinación de la región distal del cromosoma 6 en las 34 plantas susceptibles de la población de mapeo. Los fragmentos naranjas indican el alelo susceptible de FT-2001, fragmentos verdes indican el alelo resistente de MJ19RR mientras que fragmentos azules indican regiones heterocigotas.
Eleven additional SSR were selected from the Satt433 genomic region covering about 40 cM, five of which produced polymorphic bands in the parental genotypes (table 1, page 30). Satt433, Satt079 and Satt307 were included in the analysis and the chi-square test confirmed the segregation of theses markers with mendelian ratio (table 3, page 32). Using GQMOL the Satt433 marker was positioned at 25.1 cM from Satt307 and at 34.2 cM from Satt079, whereas resistance to SSC (RdmMJ19RR) was located at 13.3 cM from Satt433 (figure 1, page 34).
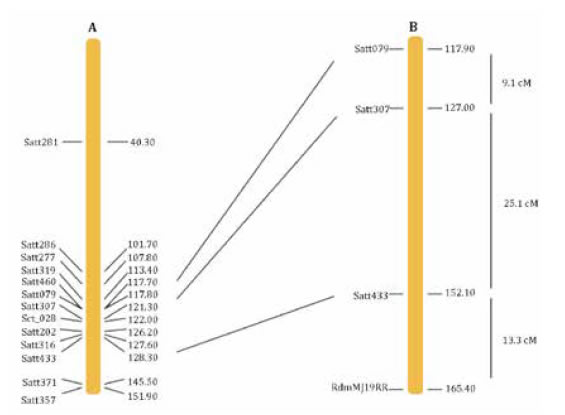
Figure 1. Section of chromosome 6 showing position of RdmMJ19RR locus. A, reference map (19). B, genetic map obtained in the present study.
Figura 1. Sección del cromosoma 6 donde se localiza el locus RdmMJ19RR. A, mapa de referencia (19). B, mapa genético obtenido en el presente trabajo
This region has not been previously reported as associated with SSC resistance.
The recombination in the 34 susceptible plants was evaluated with the Satt079, Satt307 and Satt433 markers. As shown in figure 2 (page 35), recombination in all analyzed locus, were observed. Satt371 and Satt357, located in the distal region of Chr 6, were monomorphic for MJ19RR and FT-2001. It was not possible to analyze recombination at the distal end of this chromosome.
Resistance sources characterization
Nine soybean genotypes, among which are all known sources of SSC resistance, were analyzed with seven SSR markers of the Chr 6 region where RdmMJ19RR was mapped (figure 3, page 36).
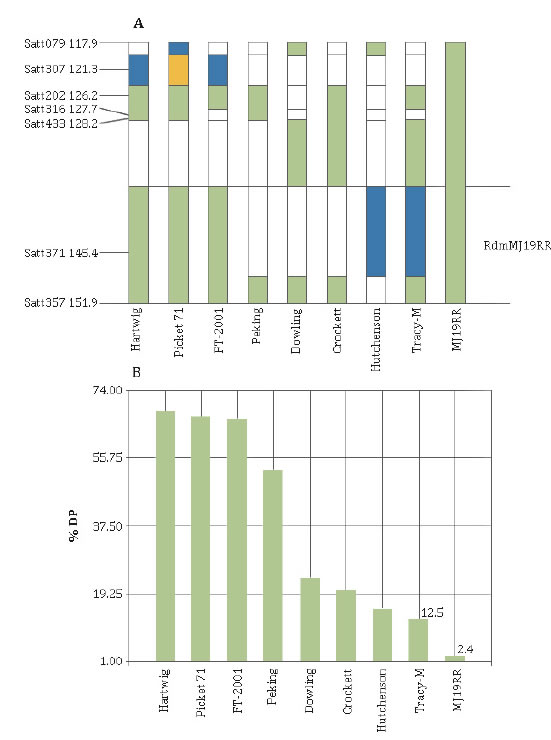
Figure 3. A: allelic combination of the distal end of chromosome 6 in all known Dpm resistance sources. Green fragments denote presence of alleles resistant of MJ19RR. B: percentage of dead plant index (% DP) with response to Dpm (RS12) inoculation.
Figura 3. A: combinación alélica del extremo distal del cromosoma 6 en todas las fuentes de resistencia al Dpm conocidas; fragmento verde representa los alelos del genotipo resistente MJ19RR. B: Porcentaje del índice de plantas muertas (% DP) como respuesta a la inoculación con Dpm (RS12).
The resistant allele from Satt433 was amplified in MJ19RR, Tracy M, Crockett and Dowling. The only resistant genotype that did not showed the resistance allele was Hutcheson. Amplifications of the loci Satt316 and Satt202 produced the same alleles in MJ19RR, Tracy-M, Crocket, Peking, FT-2001, Pickett71 and Hartwig, except Tracy-M and FT-2001 that showed different alleles for Satt316. With the Satt307 and Satt079 markers all genotypes amplified different alleles than MJ19RR, except Hutcheson and Dowling for the Satt079 locus. Analysis with Satt371 marker showed the same allele in MJ19RR, FT-2001, Pickett71 and Hartwig, while Satt357 amplified the same allele in all genotypes except in Hutcheson. Overall, these results indicate that there was no a clear relationship between the studied haplotypes.
DISCUSSION
This research presents the first genomic approximation to stem canker resistance using bulk segregant analysis. The selection of SSR candidates according to the intensity of the resistant allele amplification in the susceptible bulk, was efficient in localizing the genomic region associated with the resistance. This strategy allowed the identification of the genomic region of interest, using few polymorphic molecular markers, a common situation when we used domestic parental for develop mapping population. When analyzing F2 generation of the mapping population, we showed that the genetic resistance of MJ19RR was the result of a single dominant gene. In this case, the hypothesis was confirmed considering 113 F2 plants as resistant, which did not show symptoms (immune), while the remaining 34 susceptible plants showed clearly identifiable symptoms throughout the hypocotyls (photo 1, page 29). This stark contrast between resistant and susceptible plants in the mapping population leaves no doubt of the inheritance of this gene and demonstrates the consistency of the resistance reaction of MJ19RR against an aggressive isolate of Dpm.
The genotypic analysis located the resistance at Chr 6, linked to Satt433 marker at 13.3 cM (figure 1, page 34). The recombination between Satt433 and RdmMJ19RR in eight susceptible plants suggested that resistance to SSC could be located in the distal region of Chr 6 (figure 2, page 35). The lack of polymorphism between MJ19RR and FT-2001 at Satt371 and Satt357 prevented the recombination study in the distal end of the chromosome.
This region on Chr 6 of the soybean map was previously reported as responsible for resistance to sudden-death syndrome (6, 8, 16), to Phytophthora sojae (12), to Asian soybean rust in cv. FT-2001 (18). Also, resistance to Heterodera glycines was mapped by (1, 22). These findings support the idea of a clustered location of resistance genes related to biotic stress, which is very valuable for breeding programs.
The presence of physiological breeds of Dpm that show a differential response to different Rdm genes was already reported (17). They observed that there are very aggressive breeds in Argentina which are controlled only by the Rdm1 gene. However lower % DP values were observed when this gene was accompanied by Rdm2 in the Tracy-M genotype. In our research, the Tracy-M showed % DP values corresponding to the resistance reaction (R), but Dowling, Crocket and Hutchenson showed moderately susceptible (MS) responses (table 2, page 32). This result suggests that RSF12 is a very aggressive isolate, because it is only controlled by Tracy-M (Rdm1/Rdm2).
Although we are not aware of the resistance source from where MJ19RR originated, reaction similarities between MJ19RR and Tracy-M could indicate that both genotypes share a genetic base for Dpm resistance. Using SSR markers, we aligned the haplotypes of our parental genotypes with all the possible Dpm resistance sources known and their respective reactions to RSF12 isolation (figure 3, page 36). The comparison of the genomic region from distal end of Chr 6 for genotypes MJ19RR and Tracy-M, showed similarities for Satt357 locus between both genotypes. In this sense, Tracy-M could be the sole potential responsible for MJ19RR resistance, considering that all the sources of resistance was tested in this experiment.
The Rdm2 gene controls less aggressive breeds which are also controlled by other known genes (Rdm1,3,4) (17), while in our research the RSF12 variant was only controlled by Tracy-M genotype, a combination of Rdm1 and Rdm2 genes. In this way if the resistance of MJ19RR derived of Tracy-M, then it should be through the Rdm1 gene. Nevertheless, the agronomic difference of the % DP values between MJ19RR (2.4%) and Tracy-M (12.5 %), the lack of dead plants and the sole resistance gene in MJ19RR, support the idea that these genotypes have different genetic basis for Dpm resistance.
Anyway, our experiments were unable to determine if the MJ19RR response is product of Rdm1, an allelic variation of this, or a new gene of other locus.
Finally, in this paper we showed that resistance of MJ19RR controls a very aggressive Dpm variant through a single gene, indicating that this genotype is a very important tool for genetics breeding programs.
CONCLUSIONS
The RSF12 was the most aggressive isolate while MJ19RR was the only genotype where no dead plants resulted from inoculations. This fact revealed MJ19RR as a promising source of resistance to SSC.
The genetic resistance of MJ19RR to SSC is determined by a single gene, located at the distal end of chromosome 6 at 13.3 cM of the Satt433 marker.
This study determined that the agronomic reaction of the soybean genotype MJ19RR against the RSF12 isolate is different from the rest of the known resistance sources, strongly indicating the presence of a new gene.
1. Arriagada, O.; Mora, F.; Dellarossa, J. C.; Ferreira, M. F.; Cervigni, G. D.; Schuster, I. 2012. Bayesian mapping of quantitative trait loci (QTL) controlling soybean cyst nematode resistant. Euphytica. 186: 907-917. DOI: 10.1007/s10681-012-0696-y.
2. Bowers, G. R.; Ngeleka, K.; Smith, O. D. 1993. Inheritance of stem canker resistance in soybean cultivars Crockett and Dowling. Crop Sci. 33: 67-70. DOI: 10.2135/cropsci1993.00111 83X003300010010x.
3. Chiesa, M. A; Pioli, R. N.; Morandi, E. N. 2009. Specific resistance to soybean stem canker conferred by the Rdm4 locus. Plant Pathol. 58: 1032-1039. DOI: 10.1111/j.1365- 3059.2009.02145.x.
4. Cruz, C. D.; Schuster, I. 2004. GQMOL-Aplicativo computacional para análise de dados moleculares e de suas associações com caracteres quantitativos. Universidad Federal do Viçosa. Viçosa. Brazil.
5. Fernández, A. F.; Hanlin, R. T. 1996. Morphological and RAPD analyses of Diaporthe phaseolorum form soybean. Micologia. 88: 425-440. DOI: 10.2307/3760884.
6. Iqbal, M. J.; Meksem, K.; Njiti, V. N.; Kassem, M. A.; Lightfoot, D. A. 2001. Microsatellite markers identify three additional quantitative trait loci for resistance to soybean suddendeath syndrome (SDS) in Essex × Forrest RILs. Theor. Appl. Genet. 102: 187-192. DOI: 10.1007/s001220051634.
7. Ivancovich, A. J.; Botta, G. L.; Annone, J. 1992. Aparición del cancro del tallo en cultivos de soja del área de la E.E.A. Pergamino. Información N°95. EEA INTA Pergamino.
8. Kazi, S.; Shultz, J.; Afzal, J.; Johnson, J.; Njiti, V. N.; Lightfoot, D. A. 2008. Separate loci underlie resistance to root infection and leaf scorch during soybean sudden death syndrome. Theor. Appl. Genet. 116: 967-977. DOI: 10.1007/s00122-008-0728-0.
9. Keeling, B. L. 1982. A seedling test for resistance to soybean stem canker caused by Diaporthe phaseolorum var. caulivora. Phytopathology. 72: 807-809. DOI: 10.1094/Phyto-72-807.
10. Keeling, B. L. 1988. Influence of temperature on growth and pathogenicity of geographic isolates of Diaporthe phaseolorum var. caulivora. Plant Dis. 72: 220-222. DOI 10.1094/PD-72-0220.
11. Kilen, T. C.; Hartwig, E. E. 1987. Identification of single genes controlling resistance to stem canker in soybean. Crop Sci. 27: 863-864. DOI: 10.2135/cropsci1987.0011183X002700050005x.
12. Li, X.; Han, Y.; Teng, W.; Zhang, S.; Yu, K.; Poysa, V.; Li, W. 2010. Pyramided QTL underlying tolerance to Phytophthora root rot in mega-environments from soybean cultivars 'Conrad'and 'Hefeng 25'. Theor. Appl. Genet. 121: 651-658. DOI: 10.1007/s00122-010-1337-2.
13. Michelmore, R. W.; Paran, I.; Kesseli, R. V. 1991. Identification of markers linked to disease resistance genes by bulked segregant analysis: a rapid method to detect markers in specific genomic region by using segregation population. P. Ntl. Acad. Sci. USA. 88: 9828-9832. DOI: 10.1073/pnas.88.21.9828.
14. Morgan-Jones, G. 1989. The Diaporthe/Phomopsis complex: Taxonomic considerations. Proceeding of the World Soybean Research Conference IV. Buenos Aires. Argentina. 1699-1706.
15. Murray, M. G.; Thompson, W. F. 1980. Rapid isolation of high-molecular-weight plant DNA. Nucleic Acids Res. 8: 4321-4325. DOI: 10.1093/nar/8.19.4321.
16. Njiti, V. N.; Meksem, K.; Iqbal, M. J.; Johnnson, J. E.; Kassem, M. A.; Zobrist, K. F.; Kilo, V. Y.; Lightfoot, D. A. 2002. Common loci underlie field resistance to soybean sudden death syndrome in Forrest, Pyramid, Essex, and Douglas. Theor. Appl. Genet. 104: 294-300. DOI: 10.1007/s001220100682.
17. Pioli, N. R.; Morandi, E. N.; Martínez, M. C.; Lucca, F.; Tozzini, A.; Bizarro, V.; Hopp, H. E. 2003. Morphologic, molecular, and pathogenic characterization of Diaporthe phaseolorum variability in the core soybean-producing area of Argentina. Phytopathology. 93: 136-146. Available in: http://dx.doi.org/10.1094/PHYTO.2003.93.2.136.
18. Silva, D. G. C.; Yamanaka, N.; Polizel, A. M.; Brogin, R. L.; Pereira, S. S.; Nogueira, L. M.; Passianoto, A. L. L.; Catelli, L. L.; Arias, C. A. A.; Nepomuceno, A. L. 2006. Mapeo de genes de resistencia a roya asiática en soja. Resúmenes 3° Congreso de Soja del MERCOSUR. Rosario. Argentina.
19. Song, Q. J.; Marek, L. F.; Shoemaker, R. C.; Lark, K. G.; Concibido; V. C.; Delannay, X.; Specht, J. E.; Cregan, P. B. 2004. A new integrated genetic linkage map of the soybean. Theor. Appl. Genet. 109: 122-128. DOI: 10.1007/s00122-004-1602-3.
20. Tyler, J. M. 1996. Characterization of stem canker resistance in ¨Hutcheson¨ soybean. Crop Sci. 36: 591-593. DOI: 10.2135/cropsci1996.0011183X003600030011x.
21. Van Berloo, R. 2008. GGT2.0: versatile software for visualization and analysis of genetic data. J. Hered. 99: 232–236. DOI: 10.1093/jhered/esm109.
22. Yue, P.; Arelli, P. R.; Sleper, D. A. 2001. Molecular characterization of resistance to Heterodera glycines in soybean PI 438489B. Theor. Appl. Genet. 102: 921-928. DOI: 10.1007/s001220000453.
ACKNOWLEDGEMENTS
We gratefully acknowledge revision of the manuscript by Ing. Carolina Caram Di Santo (CONICET), PhD. Valeria Faggioli (INTA) and to Beatriz Masiero (INTA) for her assistance in the statistical analysis.