ORIGINAL ARTICLE
Molecular versus morphological markers to describe variability in sugar cane (Saccharum officinarum) for germplasm management and conservation
Marcadores moleculares y morfológicos para la descripción de variabilidad en caña de azúcar (Saccharum officinarum) con fines de manejo y conservación de germoplasma
Mariana I. Pocovi1 *, Norma G. Collavino1, Ángela Gutiérrez1, Gisel Taboada1, Verónica Castillo1, Romina Delgado1, Jorge A. Mariotti1
1 Universidad Nacional de Salta. Facultad de Ciencias Naturales. Laboratorio de Marcadores Moleculares. Av. Bolivia 5150. C. P. 4400. Salta. Argentina. * fcn13161@gmail.com
Originales: Recepción: 29/08/2018 - Aceptación: 15/10/2019
ABSTRACT
Sugarcane is one of the most important industrial crops in tropical and subtropical regions. INTA (Argentina) administrates a Sugarcane Germplasm Bank and carries out a breeding program. The current study was designed to assess the phenotypic and genetic diversity among 65 sugarcane accessions selected from the INTA bank. Clustering and ordination methods based on quantitative and qualitative morphological traits and SSR data, were applied. Generalized Procrustes Analysis allowed evaluating the correlation between relationships established with both markers. A good fit between dendrograms and similarity matrices were revealed by high cophenetic coefficients (r=0.82, p<0.0001; r=0.73, p<0.0001; r=0.82, p<0.0001 for phenotypic quantitative, phenotypic qualitative and molecular data respectively). The presence of different reliable population structure was observed when considering different data sources. Procrustes allowed finding those accessions that should have been responsible for the low correlation found between the individual configurations (73%). Both morphologic and molecular markers resulted discriminative enough to differentiate among accessions. It was not possible, however, to correlate associations of markers with the origin of materials. Phenotypic and genetic distances based on morphology and molecular information serves to assist conservation and organization of collection of materials, and the choice of parent combinations for breeding purposes.
Keywords: Multivariate analysis; Morphological traits; SSR; Sugarcane; Genetic
RESUMEN
La caña de azúcar es uno de los cultivos industriales más importantes de regiones tropicales y subtropicales. El INTA (Argentina) administra un Banco de Germoplasma de caña de azúcar y lleva a cabo un programa de mejora. El presente trabajo fue diseñado para estimar la variabilidad fenotípica y genética entre 65 accesiones de caña de azúcar seleccionadas del INTA. Se aplicaron métodos de clasificación y ordenamiento en el análisis de datos morfológicos y de SSR. EL Análisis de Procrustes Generalizado permitió evaluar la correlación entre las relaciones establecidas a partir de ambos tipos de marcadores. Un buen ajuste entre los dendrogramas y las matrices de similitud fue soportado por un alto coeficiente de correlación cofenética (r=0,82, p<0,0001; r=0,73, p<0,0001; r=0,82, p<0,0001 para datos cuantitativos, cualitativos y moleculares respectivamente). La presencia de una estructura poblacional fue reconocida cuando se consideraron los diferentes tipos de datos. El Procrustes permitió detectar aquellas accesiones que serían responsables de la baja correlación detectada entre configuraciones individuales (73%). Tanto los marcadores morfológicos como los moleculares resultaron lo suficientemente discriminativos para diferenciar accesiones. No obstante, no fue posible correlacionar las asociaciones establecidas por los marcadores con el origen de los materiales. Las distancias fenotípicas y genéticas basadas en información morfológica y molecular será de utilidad para asistir en la conservación y organización de los materiales de la colección y elegir combinaciones parentales con propósito de mejora.
Palabras claves: Análisis multivariado; Caracteres morfológicos; SSR; Caña de azúcar; Variabilidad genética
INTRODUCTION
Sugarcane is one of the most important industrial crops in tropical and subtropical regions. It is cultivated in more than 90 countries around the world, primarily for its ability to store high concentrations of carbohydrates to produce sugar and biofuel. INTA (Instituto Nacional de Tecnología Agropecuaria) administrates the main Sugarcane Germplasm Bank in Argentina and conducts a breeding program for this crop.
The germplasm bank fulfils aspects related to exploration, collection, evaluation, preservation and germplasm exchange. The core collection currently includes 429 sugarcane accessions and 120 clones from an annex collection with high Brix (total soluble solids) materials, an attribute related to potential sucrose yield. Some morphological traits have been measured to characterize these materials aiming at improving ttheir breeding value. However, these genetic markers have several limitations including low polymorphism, low heritability, late expression, and vulnerability to environmental influences. In addition, it is known that morphological traits do not always provide a sound measure of genetic values and may not accurately reveal the genetic variation in germplasm collections (13). Since germplasm provides the raw material for breeders to improve crop performance, knowledge on genetic variability should be an auxiliary tool for breeding and an important link between the conservation and use of sugarcane available genetic resources. Interesting genetic resources for breeders include advanced material (e.g. pre-bred material, breeding lines, adapted varieties, elite materials) and research material (e.g. advanced core collections, mapping populations). However, researchers and other users may be interested in a wider range of materials. The conservation of genetic diversity in germplasm banks broadens the spectrum of materials targeted for storage (14). The usefulness of samples held in germplasm banks is dependent on the degree and quality of information connected to the samples (14). Morphological markers reflect variation of expressed regions of genome while molecular markers indicate variation of all genome including expressed and non-expressed regions. It has been reported that the patterns of allelic variation in a species may be very different for neutral markers compared with genes under selection. Based on a meta-analysis, Latta (2008) argued that variability at neutral and selected loci are not correlated because evolutionary forces act differently on them. Reed and Frankham (2003) showed only weak correlation between neutral molecular markers and morphological quantitative measures of variation. A joint analysis of morphological and molecular variability would undoubtedly increase the resolving power of the genetic diversity analysis of the sugarcane germplasm bank. It would also allow criteria for both, the choice of progenitor combinations to maximize the genetic variability of the progeny in the breeding program and to maintain variability of the germplasm collection. For those purposes, it is necessary to deal with a large number and different types of variables. The multivariate analysis has allowed the simultaneous evaluation of many traits by summarizing information in few synthetic variables. It has also permitted a better understanding of the structure of the sugar cane germplasm collection, helping to identify which variables are more relevant in order to identify relationships among accessions (3). The current study was designed to assess the phenotypic and genetic diversity of 65 sugarcane accessions selected from INTA's Germplasm Bank (Tucumán, Argentina), determining both the discriminating power and effectiveness of different SSR primers for sugarcane genotype identification and the optimal SSR primer combination to ensure unambiguous identification of a set of sugarcane genotypes. In addition, we also evaluated the correlation between the sugarcane accessions relationships established with both morphological and molecular data in order to provide guidance for future use of sugarcane accessions in the breeding programme and germplasm bank management.
MATERIALS AND METHODS
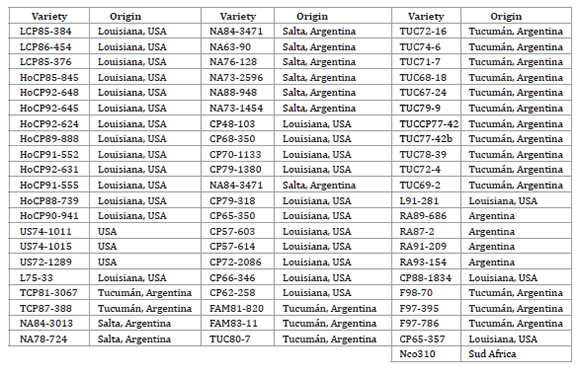
Sixty five sugarcane accessions from the INTA Germplasm Bank (Tucumán, Argentina) were included in this study (table 1, page 43).
Table 1. Sugarcane accessions included in the genetic variability analysis and Province- Country of origin (CO).
Tabla 1. Accesiones de caña de azúcar incluídas en el análisis de variabilidad genética y sus Provincias-Países de origen (CO).
Most of these genotypes are of interest for breeding purposes in Argentina due to their adaptability to subtropical growing areas (short cycle and early maturity). Some of these materials are or were used as commercial varieties in Argentina and other countries.
Three basic materials (identified as US) were also included. Sugarcane accessions were grown in the greenhouse under controlled conditions.
Morphological traits
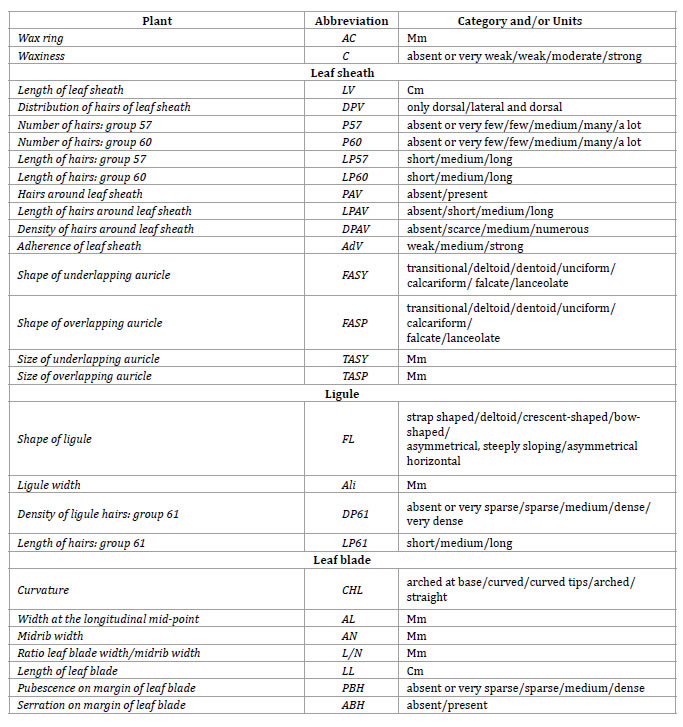
A total of 59 morphological variables from stem and leaf were evaluated. From these, 43 correspond with sugarcane UPOV (Union for the Protection of New Varieties of Plants) descriptors, while 16 are descriptors defined by Wagih (2004). Morphological traits comprised both qualitative (43) and quantitative (16) attributes. Most of these attributes (48) are not subjected to selection in breeding programs; 4 of them, related to stem traits, are subjected to screening as primary conditioning requisites, while other 7 are subsidiary traits related to leaves and canopy (table 2, page 44-45).
Table 2. Qualitative and quantitative morphological markers assessed in 65 accessions of sugarcane. Name, abbreviation and categories or units is indicated for each variable.
Tabla 2. Marcadores morfológicos cualitativos y cuantitativos estudiados en 65 accesiones de caña de azúcar. Para cada variable se indica el nombre, abreviatura y la categoría o unidades.
Table 2 (cont.). Qualitative and quantitative morphological markers assessed in 65 accessions of sugarcane. Name, abbreviation and categories or units is indicated for each variable.
Tabla 2 (cont.). Marcadores morfológicos cualitativos y cuantitativos estudiados en 65 accesiones de caña de azúcar. Para cada variable se indica el nombre, abreviatura y la categoría o unidades.
The accessions were planted in 2017-2018 in single raw evaluation plots of 1 m length (50 cm spacing) at the experimental greenhouse of Universidad Nacional de Salta (24°43'22" S and 65°24'74" W). Irrigation was provided at appropriate time according to requirements. Data on measurable morphological characters, were recorded on year after planting. Quantitative traits were measured on five random stems for each accession and data were averaged.
All measures and observations were carried out in the greenhouse and laboratory by means of metric rule and calipter or under stereoscopic binocular loupe, by the same operators for each attribute, considered stable enough for the different genotypes.
SSR
Total genomic DNA was extracted from young leaves (+1 in Kuijper's denomination) (6) using a DNA Nucleospin II extraction kit following the manufacturer protocol. The quality and quantity of DNA was assessed using a NanoDrop ND-1000 (Thermo Fisher Scientific Inc., Waltham, USA) with 1 μl sample. Based on the consistency of band patterns obtained in a previous study, twenty SSR primers were evaluated (table 3).
Table 3. Simple Sequence Repeat (SSR) primers used for genotyping 65 sugarcane accessions from the INTA Sugarcane Germplasm Bank (Tucumán, Argentina).
Tabla 3. Cebadores de Secuencias Repetitivas Simples (SSR) usados para el genotipado de 65 accesiones de caña de azúcar del Banco de Germoplasma de INTA (Tucumán, Argentina).
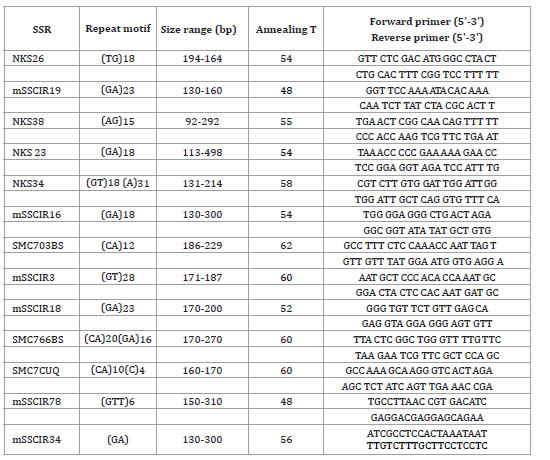
Polymerase chain reactions (PCRs) and electrophoresis and gel staining were carried out according to Pocoví et al. (2013) The resulting banding pattern was scored manually. Only consistent bands with strong intensity were considered for the analysis.
Despite being co-dominant, SSR markers were here considered as dominant markers, because in highly polyploid genomes such as that of sugarcane, the SSR markers difficulty distinguish the alleles of homologous chromosomes, making it difficult to determine heterozygosity or homozygosity at any particular locus. From this assumption, each band was treated as a unit locus and a binary system was considered scoring each individual for presence (1) or absence (0) of a band.
Statistical multivariate analysis
Clustering methods
For quantitative variables, phenotypic relationships between pairwise of sugarcane accessions were assessed using Euclidean distance calculated with their standardized means. To measure similarities between pairwise of genotypes on the basis of multistate qualitative traits, the Simple Matching Coefficient was used (25). For molecular data, relationships between pairwise of accessions were estimated using the Jaccard Coefficient. In the three cases, the accessions were then clustered by the Unweighted Pair- Group Method with Arithmetic Averages (UPGMA). Cophenetics values matrices (25) of the UPGMA clustering were used to test goodness-of-fit of the clustering to the similarity matrix on which it was based, by means of computing the product-moment correlation (r) with 1000 permutations (Mantel, 1967). The relative support for the different groups and stability of the dendrograms were assessed by bootstrap analyses (1000 replicates). Bootstrap values exceeding a 50% cut-off are indicated above the corresponding clusters in the respective figures.
Ordination methods
A principal Component Analysis (PCA), using the canonical Euclidean distance from quantitative morphological data, was carried out. The ordination was visualized simultaneously by means of biplots where sugarcane genotypes and variables were represented in a common space. For qualitative morphological and molecular data, genetic similarities matrices were used to perform Principal Coordinate Analysis (PCoA). According to Cliff (Franco and Hidalgo, 2003), only those coordinates whose accumulated values accounted for 70% or more of the total variance were considered. To facilitate the understanding of the relationships sugarcane accessions, geometrical representations were obtained using Minimum Spanning Trees (MST).
In order to establish agreement or consensus between relationships among observations derived from morphological and molecular data, a Generalized Procrustes Analysis (GPA) was carried out. Statical analyses were performed using Infostat v.2013 (9) and DARwin 6.0.0 software program (20).
RESULTS AND DISCUSSION
Phenotypic variability based on quantitative traits
The highest distance value was estimated between the genotypes TUC79-9 and TCP81-3067 (10.79). In opposition, HoCP88-739 and HoCP91-555 were very close to each other showing the lowest Euclidean distance value (0.48). Non-Euclidean distance between pairs of accessions was zero meaning that quantitative traits included in this study were sufficiently discriminative to differentiate unequivocally among all the accessions. The dendrogram generated with UPGMA cluster analysis of de Euclidean distance matrix, revealed nine clusters with more than 50% bootstrap values (figure 1).
Figure 1. Dendrogram (UPGMA) constructed with Euclidean distances based on quantitative morphological data.
Figura 1. Dendrograma (UPGMA) basado en datos morfológicos cuantitativos construido a partir de distancias Euclídeas.
Probably, the small number of clusters supported by bootstrap can be explained due to many pair-wise genetic similarity coefficients with intermediate values, which allow several similar variants for dendrogram branching.
The cophenetic correlation between the dendrogram and the similarity matrix was significant (r=0.82; p<0.0001) revealing a high degree of fit.
Detail analysis of the cluster's composition does not show association patterns related to the origin or other agronomic characteristics of the materials. This result is interpreted because of the nature of the descriptors investigated, given that most of them are not associated with selection objectives of breeding. This fact can also explain the confusion of basic materials (US) with commercial ones.
The PCA analysis allowed reducing the set of correlated quantitative variables to a small number of linear combinations of these variables (principal components) such as expected (3).
The first four principal components (PCs) had eigenvalues higher than one. The first and second synthetic variables (PC1 and PC2) explained 45% of the total variability. PC1, with an eigenvalue of 4.74, would contain equivalent information from at least four original quantitative variables. PC2, with an eigenvalue of 2.47, corresponded to two variables. According to Bhanupriya et al. (2014), characters with largest absolute value (eigenvectors) closer to unity within the first principal component, influence the clustering more than those with lower absolute value closer to zero. In the present study, differentiation of sugarcane accessions into different groups in PC1 can be explained because of the contribution of leaves descriptors (Leaf sheath length, Ligule width, Midrib width, ratio Leaf blade width/Midrib width, with eigenvalues of 0.30, 0.35, 0.30, 0.35, respectively) and cane traits (Internode diameter, Bud width, Length of the cane top with eigenvalues of 0.34, 0.25, 0.45, respectively) Except for diameter, the other descriptors influencing on PC1 are not primary but subsidiary traits for breeding. According to Gutiérrez-Miceli et al. (2002), the internode diameter is correlated with the sucrose content, so in the case of diameter it should be also considered that the range of the sample is strongly limited for being commercial type materials. These facts reinforce confounding associations discussed previously. According to Mohammadi and Prasanna (2003) when the total variation explained by the first two or three PCs is smaller than 25%, PCA provides faithful portrayal of the relationships between major groups of lines, but distances between closer genotypes are often distorted. In this study, PC1 and PC2 explained 45% of the original variation and allowed a better understanding on the structure of sugarcane genotypes. PC1 accounted for 30% of the morphological variation. Twenty of the 26 accessions (77%) classified in the first cluster (UPGMA) were grouped to the left of PC1, these genotypes would have greater ratio Leaf blade width/Midrib width than those on the right of CP1 (figure 2, page 50).
Figure 2. PCA biplot of 16 quantitative morphological traits with 65 sugarcane accessions and eigenvalue vectors for the traits.
Figura 2. Biplot PCA de 16 caracteres morfológicos cuantitativos con 65 accesiones y vectores de autovalores para los caracteres.
According to Di Rienzo et al. (2013), the orthogonality of the principal components ensures that CP2 provides new information on variability compared to that provided by CP1. In this study, genotypes that could not be differentiated by leaf traits on PC1 could be identified by PC2, being stem height the main attribute associated to this component. Accession CP48-103 is the genotype with greater stem height.
Again, in this study, PCA analysis could not clearly differentiate materials according to their origin or nature (US) based on the morphological descriptors investigated.
Phenotypic variability based on qualitative traits
Morphological qualitative traits were also discriminative. Although some pairs of sugarcane accessions were phenotypically very close, with dissimilarities coefficients near zero (0.102), none of them showed a zero value. The histogram of pairwise dissimilarity from the qualitative data indicates a normal distribution. The dissimilarity coefficients ranged from 0.102 to 0.731. The fact that most of the dissimilarity coefficients ranged between 0.35 and 0.50 can probably explain that few internal branches (3) in the dendrogram (UPGMA) supported by bootstrapping (figure 3, page 51).
Figure 3. Dendrogram (UPGMA) constructed with Simple Matching Coefficients based on qualitative morphological data.
Figura 3. Dendrograma (UPGMA) basado en datos morfológicos cualitativos utilizando el Coeficiente de Simple Matching.
The cophenetic correlation between the dendrogram and the similarity matrix was significant (r=0.73; p<0.0001) indicating a good agreement between the graphical display of distances and the original matrix, supporting the visual inferences suggested in figure 3 (page 51). None of the sugarcane accession pairs with minimum and maximum distance values coincided with genotype pairs that appeared closer and more distant on the bases of quantitative data.
These differences could be explained because both types of quantitative and qualitative descriptors have different genetic bases and imply different genomic regions. It is expected that qualitative traits are mainly under monogenic or oligogenic control, conversely, quantitative traits have more complex genetic base as they are usually governed by multiple genes and their interactions (7). A much wider genomic area is expected to be considered when phenotypic relationships are estimated from quantitative data.
As in the case of the analysis based on quantitative traits, it was not possible to distinguish associations between qualitative based arrangements with the origin of materials. US 74-1011 and US72-1289 appear closely related and separated of commercial type accessions, while US74-1015 appears confounded with commercial types in a separate group.
PCA results based on qualitative data were not considered due to eigenvalues lower than 1, meaning that no PC explained even an original variable and small proportion of variance accounted for by the first two components (21%). ACP based on these qualitative data seemed to be inefficient to conglomerate defined sugarcane accessions groups.
Genotypic variability based on SSR
With 13 SSR primers, a total of 107 bands were detected of which, 94% were polymorphic among the studied sugarcane accessions.
The dissimilarity matrix, calculated from binary data, expressed the similarity pair to pair between sugarcane genotypes. The histogram of frequency distribution of the pairwise genetic distances fitted a normal distribution. Distance coefficients values among a total of 1711 pairs of genotypes showed an overall mean of 0.43. Of note, no dissimilarity value was zero, indicating that SSR included in this study were sufficiently discriminative for the sugarcane accessions. Most of the pairs of genotypes showed distances between 0.4 and 0.5, which allowed several similar variants for dendrogram branching and probably could explain the small number of clusters supported by bootstrap. Clustering percentage values above 50% for 1000 bootstrap cycles occurred in only seven groups (figure 4).
Figure 4. Consensus dendrogram (UPGMA) constructed with dissimilarity genetic distances based on SSR data.
Figura 4. Dendrograma consenso (UPGMA) construido sobre la base de datos SSR utilizando medidas de disimilitud genética.
These dissimilarities values are like those reported by other authors in this species (18). According to the information indicated in table 4, we suggest that thirteen pairs of sugarcane accessions, with dissimilarities values higher than 0.65, might be considered as parental combinations accessions in the Breeding Programme, and thus, it could to some degree, benefit the broadening of the genetic basis in sugarcane hybridization.
Table 4. Pairs of sugarcane accessions, with dissimilarities values higher than or equal to 0.60.
Tabla 4. Pares de accesiones de caña de azúcar con valores de disimilitud mayores o iguales a 0,60.
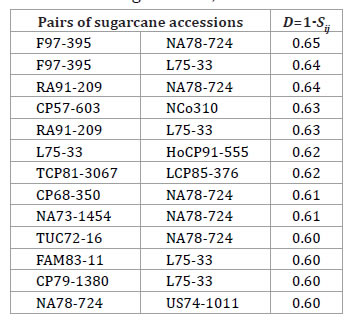
According to You et al. (2013), the innovation of parents with higher genetic diversity showed a positive role in sugarcane breeding programs in China. They suggested that more attention should be paid in the future to the selection of new parents in sugarcane hybrid breeding.
Differences were clear within clusters derived from quantitative morphological and molecular data. In both cases, cophenetic correlation coefficients were 0.82 indicating a high correlation between cophenetic distances and input distance matrices obtained from the data. Since cophenetic distance between two accessions is the distance at which two genotypes are first clustered together in a dendrogram from the bottom to the top (19), the cophenetic correlation coefficient, therefore, measures the relationships between the original pair wise distances between accessions (true distance) and pair wise distances predicted using dendrogram. In both cases, dendrograms corresponded graphically to 82% of the dissimilarity matrices. According to Odong et al. (2011) cophenetic correlation coefficient ≤ 0.8 is an indicator for strength of subgroup differentiation. Our results showed the presence of different reliable population structure in the studied sugarcane accessions when morphological and molecular data were considered. The phenotypic variation does not always follow the genetic pattern of variation and diversity of plant populations. The lack of congruence between morphological and genetic diversity has been reported in different plant species (1, 24).The different clustering can be explained due to a partial and insufficient genome representation when morphological data are used. Semang (2000) explained the lack of correspondence between molecular and morphological results, when stated that molecular markers cover a larger proportion of the genome, (including coding and noncoding regions), than the morphology ones. In addition, a large portion of the genetic variation detected by molecular markers is non-adaptive and, therefore, they are not subjected to either natural or artificial selection as many morphological traits.
Differences in clustering can also be explained due to an absence of linkage between the loci that control the studied morphological characters and the evaluated SSR markers.
The first PCo summarized most of the variability present in the original data (28%) relative to all remaining PCos. The second PCo explained 9% of the variability and because PCos are orthogonal and independent to each other, they reveal different properties of the original data. According to Cliff criterion (10), the first 10 PCos explained 70% of cumulative variance, but only the first five showed eigenvalues equal to or greater than one. The minimum spanning tree (MST) imposed on the PCoA improved the representation of sugarcane relationships (figure 5).
Figure 5. Arrangement by Minimum Spanning Tree (MST) in the plane of the coordinates PC1 and PC2 of the 67 sugarcane accessions based on SSR data.
Figura 5. Árbol de recorrido mínimo (ARM) con proyección en el plano de las coordenadas PC1 y PC2 de las 67 accesiones de caña de azúcar basada en datos de SSR.
Although it was computed on the full dimension of data, the MST provided information about the quality of the projection on the low dimensional space, showing relationships that may have not been seen by inspection on the reduced space.
According to Balzarini et al. (2011) if many branches and segments cross each other, it suggests distortion problems in the projection which could bias regular interpretations. Even PCo2 explained only 9% of the variability; there is a group of accessions projected onto PCo2 that is clearly differentiated from the rest of the accessions (TUC 80-7; TUC72-16; CP68-350; CP70-1133 and HoCP85-845).
Qualitative morphological traits vs molecular markers
The distribution of values for morphological and genetic dissimilarity (calculated with qualitative traits and SSRs data) did not differ substantially. The distribution based on morphological data was slightly biased toward small values of distance (figure 6).
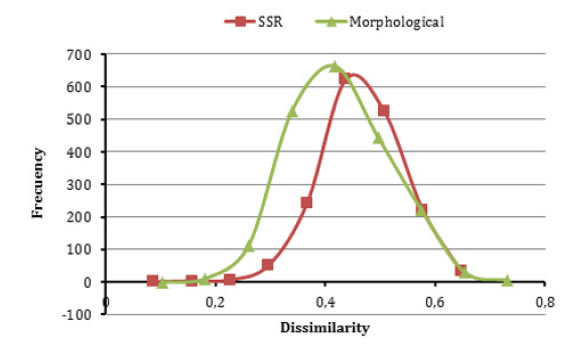
Figure 6. Frequency distribution of genetic dissimilarity among pairwise combinations of 65 sugarcane accessions based on morphological and SSR.
Figura 6. Distribución de frecuencias de disimilitudes genéticas entre pares de combinaciones de 65 accesiones de caña de azúcar basada en datos morfológicos y SSR.
Differences in the frequency distributions indicate that both types of markers detected a distinct pattern of association between sugarcane accessions. Consequently, complementary studies based on morphological and SSR will provide relevant information for establishing relationships among plant materials and a better description and interpretation of the available variability in germplasm banks and breeding programmes, as well as a foundation for promoting breeding and for germplasm conservation.
Generalized Procrustes Analysis (GPA): Consensus between morphological and molecular data
GPA allowed a deeper study of the relationships among relative ordinations of the same sugarcane accessions under morphological and SSR data. Gower's (1975) recommended calculating an ANOVA to comparatively break down the total sums of squares into the between and within configurations.
According to Bramardi et al. (2005), the latter is broken into the consensus and the residual sum of squares. This residual sum of squares measures the divergence between the two points corresponding to the morphological and molecular characterization to the consensus one, respectively (table 5, page 56-57).
Table 5. ANOVA Consensus between molecular and morphological ordinations. Accessions in bold showed the greatest discrepancy between the morphological and SSR data due to their higher relative values of Residual Sum of Squares (RSS).
Tabla 5. ANOVA Consenso entre ordenamientos basados en marcadores moleculares y morfológicos. Las accesiones en negrita mostraron las mayores discrepancias entre datos morfológicos y de SSR debido a sus valores de Sumas de Cuadrados Residuales (SCR) más altos.
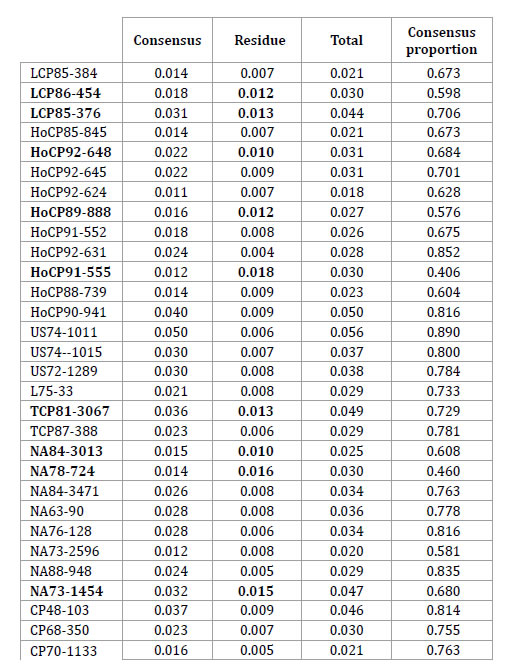
Table 5 (cont.). ANOVA Consensus between molecular and morphological ordinations. Accessions in bold showed the greatest discrepancy between the morphological and SSR data due to their higher relative values of Residual Sum of Squares (RSS).
Tabla 5 (cont.). ANOVA Consenso entre ordenamientos basados en marcadores moleculares y morfológicos. Las accesiones en negrita mostraron las mayores discrepancias entre datos morfológicos y de SSR debido a sus valores de Sumas de Cuadrados Residuales (SCR) más altos.
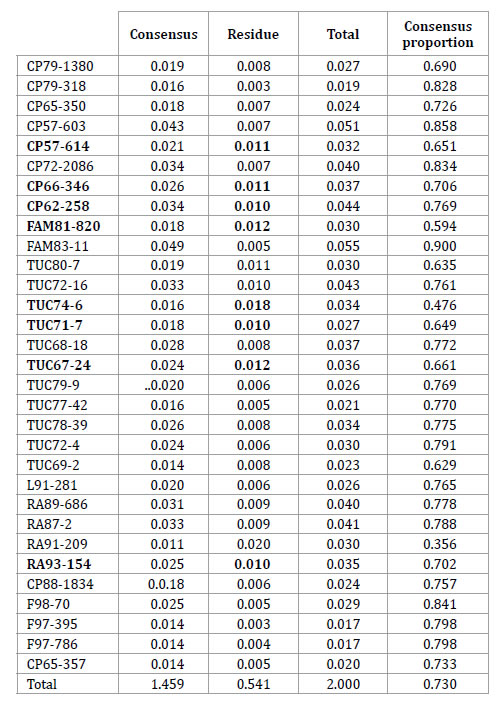
The ratio between the consensus value (1.459) and the total sum of squares revealed a consensus of 73% between molecular and agronomic ordinations (2).
This percentage of consensus is an univariate measure of association between both groups of markers. According to table 5, accessions in bold letter are those that have shown a high discrepancy between morphological and molecular data, because they have grater residual sum of square values, therefore they should have been responsible for the low correlation found between the individual configurations.
The consensus configuration of GPA with Minimum Spanning Tree (MST) is presented in figure 7 (page 58).
Figure 7. Configuration of consensus matrix of GPA between morphological and molecular data with Minimum Spanning Tree (continuous black line).
Figura 7. Configuración consenso GPA con datos morfológicos y moleculares que incluye el Árbol de Recorrido Mínimo (ARM) en línea negra.
The large number of accessions included in this study and the close genetic relationship among materials, hinders the identification of individuals in the consensus configuration.
In most of the references found for sugarcane, the assessment of the genetic variability is based, independently, on the analyses of morphological or molecular markers data.
Some papers estimate a correlation coefficient between distance matrices. According to Demey (2008), conclusions based only on correlation coefficient values can be inaccurate since the correlation is not only affected by the size of the compared samples but also because the configurations belong to the same reference system.
CONCLUSIONS
Based on results formerly presented and discussed, we propose the following general conclusions:
Both morphologic (quantitative and qualitative) and molecular markers included in this research resulted discriminative enough to differentiate among the studied accessions. It was not possible, however, to correlate associations of markers with the origin of materials.
The large number of pair-wise similarity coefficients with intermediate values determined a rather small number of nodes in clustering, which, on time, reflects the near genetic origin of most of the studied materials.
Diversity detected for morphological descriptors contributing to explain PC1 and PC2 (except for diameter), are expected since they are not usually subjected to selection in breeding.
Phenotypic and genetic distances based on morphology and molecular information serves to assist conservation and organization of collection of materials, and the choice of parent combinations for breeding purposes.
1. Ayele, T. B.; Gailing, O.; Finkeldey, R. 2011. Assessment and integration of genetic, morphological and demographic variation in Hagenia abyssinica (Bruce) J. F. Gmel to guide its conservation. Journal for Nature Conservation. 19: 8-17.
2. Balzarini, M.; Bruno, C.; Peña, A.; Teich, I.; Di Rienzo, J. 2010. Estadística en Biotecnología. Aplicaciones en InfoGen. Encuentro Grupo Editor. Córdoba. Argentina.
3. Balzarini, M.; Teich, I.; Bruno, C.; Peña, A. 2011. Making genetic biodiversity measurable: a review of statistical multivariate methods to study variability at gene level. Revista de la Facultad de Ciencias Agrarias. Universidad Nacional de Cuyo. Mendoza. Argentina. 43(1): 261-275.
4. Bhanupriya, B.; Satyanarayana, N.; Mukherjee, S.; Sarkar, K. 2014. Genetic diversity of wheat genotypes based on principal component analysis in Gangetic alluvial soil of West Bengal. J. Crop Weed. 10: 104-107.
5. Bramardi, S. J.; Bernet, G. P.; Asíns, M. J.; Carbonell, E. A. 2005. Simultaneous agronomic and molecular characterization of geno types via the generalised procrustes analysis. An Application to Cucumber. Crop Science. 45: 1603-1609.
6. Casagrande, A. A. 1991. Tópicos de morfologia e fisiología da cana-de-açúcar. Jaboticabal: Funep. 157 p.
7. Corrado, G.; La Mura, M.; Ambrosino, O.; Pugliano, G.; Varricchio, P.; Rao, R. 2009. Relationships of Campanian olive cultivars: comparative analysis of molecular and phenotypic data. Genome. 52: 693-700.
8. Demey, J. F. 2008. Diversidad genética en bancos de germoplasma: un enfoque biplot. Universidad de Salamanca. Departamento de estadística. PHD thesis Salamanca. España.
9. Di Rienzo, J. A.; Casanoves, F.; Balzarini, M. G.; Gonzalez, L.; Tablada, M.; Robledo, C. W. 2013. InfoStat versión 2013. Grupo InfoStat. FCA. Universidad Nacional de Córdoba. Argentina. URL http://www.infostat.com.ar
10. Franco, F. L.; Hidalgo, R. 2003. Análisis estadístico de datos de caracteres morfológicos de recursos fitogenéticos. Boletín Técnico N°8. IPGRI. Cali. Colombia.
11. Gower, J. 1975. Generalized Procrustes Analysis. Psychometrika. 40: 33-51.
12. Gutiérrez Miceli, F.; Arias Castro, C.; Dendooven, L.; Méndez Salas, R.; Rodriguez Mendiola, M.; Nefaltí Ochoa, A.; Bello Peréz, L. 2002. Regulación enzimática de la acumulación de sacarosa en plantas de caña de aúcar (Saccharum ssp). Agrociencia 36 (4):149.156.
13. Jansky S.; Dawson, J.; Spooner, D. M. 2015. How do we address the disconnect between genetic and morphological diversity in germplasm collections? American Journal of Botany. 102(8): 1213-1215.
14. Khoury, C.; Achicanoy, H. A.; Bjorkman, A. D.; Navarro-Racines, C.; Guarino, L.; Flores-Palacios, X.; Engels, J. M. M.; Wiersema, J. H.; Dempewol, H.; Sotelo, S.; Ramírez-Villegas, J.; Castañeda- Alvarez, N. P.; Fowler, C.; Jarvis, A.; Rieseberg, L. H.; Struik, P. C. 2017. Origins of food crops connect countries worldwide. Proceedings of the Royal Society B. 283(1832): 20160792. https://doi.org/10.1098/rspb.2016.0792
15. Latta, R. 2008.Conservation genetics as applied evolution: from genetic pattern to evolutionary process. Evolutionary applications. doi: 10.1111/j.1752-4571.2007.00008
16. Mantel, N. 1967. The detection of disease clustering and a generalized regression approach. Cancer Res. 27(2): 209-20.
17. Mohammadi, S. A. 2003. Analysis of genetic diversity in crop plants. Salient statistical tools and considerations. Crop Science. 43: 1235-1248.
18. Nair, N. V.; Selvi, A.; Srinivasan, T. V.; Pushpalatha, K. N. 2002. Molecular diversity in Indian sugarcane cultivars as reveled by Randomly Amplified DNA polymorphisms. Euphytica. 127: 219-225.
19. Odong, T. L.; Van Heerwaarden, J.; Janse, J.; Van Hintum, T. J. L.; Vaneeuwijk, F. A. 2011. Determination of genetic structure of germplasm collections: are traditional hierarchical clustering methods appropriate for molecular marker data? Theoretical and Applied Genetics. 123: 195-205.
20. Perrier, X.; Jacquemoud-Collet, J. P. 2006. DARwin software http://darwin.cirad.fr/darwin.
21. Pocovi, M.; Taboada, G.; Collavino, G.; Gutiérrez, A.; Mariotti, J. 2013. Optimal use of SSRs for establishing genetic relationships and variety identification in a collection of Sugarcane hybrids. Indian J. Plant Genet. Resour. 26(2): 103-112.
22. Reed, D. H.; Frankham, R. 2003. Correlation between fitness and genetic diversity. Conservation Biology. 17(1): 230-237.
23. Semagn, K. 2002. Genetic relationships among ten endod types as revealed by a combination of morphological, RAPD and AFLP markers. Hereditas. 37: 149-156.
24. Smissen, R. D.; Heenan, P. B. 2010. A taxonomic appraisal of the Chatham Islands flax (Phormium tenax) using morphological and DNA fingerprint data. Australian Systematic Botany. 23: 371-380.
25. Sneath, P. H.; Sokal, R. R. 1973. Numerical Taxonomy: the principles and practice of numerical classification. W. H. Freeman. San Francisco.
26. Wagih M. E.; Musa, Y.; Ala, A. 2004. Fundamental botanical and agronomical characterization of sugar cultivars for clonal identification and monitoring genetic variations. Sugar Tech. 6(3): 127-140.
27. You, Q.; Xu, L.; Zheng, Y.; Que, Y. 2013. Genetic diversity analysis of sugarcane parents in chinese breeding programmes using ssr markers. The Scientific World Journal doi:10.1155/2013/613062.