Revista de la Facultad de Ciencias
Agrarias. Universidad Nacional de Cuyo. Tomo 55(2). ISSN (en línea) 1853-8665.
Año 2023.
Original article
Cover
crops in pear (Pyrus communis) orchards: effects on soil nematode
assemblage
Cultivos
de cobertura en huertos de peras (Pyrus communis): efectos sobre el
ensamble de nematodos del suelo
Claudia Viviana
Azpilicueta1, 2*,
María Cristina
Aruani3,
Pablo Reeb3
1Ministerio
de Producción e Industria. Laboratorio de Servicios Agrarios y Forestales.
Santiago del Estero 426 C. P. 8300. Neuquén. Argentina.
2Universidad
Nacional de Río Negro. Estados Unidos 750. General Roca. C. P. 8332. Río Negro.
Argentina.
3Universidad
Nacional del Comahue (UNCo). Facultad de Ciencias Agrarias. Ruta 151. Km 12,5.
Cinco Saltos. C. P. 8303. Río Negro. Argentina.
*azpilore50@hotmail.com
Abstract
Long-term
vegetation cover can affect soil organic carbon content and carbon flow within
the soil food web. Nematode trophic structure and soil properties were
evaluated in pear rows (intra) maintained without weeds applying herbicide and
in the inter-rows (between rows) covered with: Medicago+grasses (MG),
fescue or spontaneous vegetation. Soil samples were taken at 0-20 and 20-40 cm
depths from 2012 to 2014. Nematode assemblage was different in each inter-row
and row, mainly in the topsoil. The inter-rows were reservoirs of
omnivores-predators. The MG inter-row promoted the highest accumulation of
organic carbon, total N and exchangeable K in the soil. The enrichment index
was related to the quantity of dry matter produced by cover crops with the
highest index observed in MG. Nematode biomass showed a positive correlation
with intra and inter-rows soil organic carbon. Carbon flow through bacterivores
prevailed in intra-rows, while bacterivores or herbivores canalized the
inter-rows.
Keywords: nematode trophic
groups, soil food web, metabolic footprint, soil physicochemical properties,
pear tree
Resumen
Las coberturas
vegetales a largo plazo pueden afectar el contenido de carbono del suelo y el
flujo de carbono en la red trófica del suelo. Se evaluó la estructura trófica
de nematodos y propiedades del suelo en las filas de pera mantenidas sin
malezas por aplicación de herbicidas y en los interfilares (entre filas)
cubiertos con: Medicago+gramíneas (MG), festuca o vegetación espontánea.
Las muestras de suelo fueron extraídas a 0-20 cm y 20-40 cm de profundidad
durante 2012 a 2014. El ensamble de nematodos fue diferente en cada interfilar
y fila, principalmente en el horizonte superficial. Los interfilares fueron
reservorios de nematodos omnivoros-predators. El interfilar con MG promovió la
mayor acumulación de materia orgánica, N total y potasio intercambiable en el
suelo. El índice de enriquecimiento estuvo relacionado con la cantidad de
materia seca producida por las coberturas, y los valores más altos del índice
se observaron en MG. La biomasa de nematodos se correlacionó positivamente con
el contenido de carbón orgánico del suelo en las filas e interfilares. El flujo
de carbono fue canalizado por los nematodos bacteriófagos en las filas y a
través de los bacteriófagos o herbívoros en los interfilares.
Palabras clave: grupos tróficos
de nematodos, red trófica del suelo, huella metabólica, propiedades
físico-químicas del suelo, peral
Originales: Recepción: 03/11/2022 - Aceptación: 31/07/2023
Introduction
Soil organic
matter contributes to physical, chemical and biological fertility of soil. Some
practices such as reduced tillage, direct seeding, and cover crops help
preserve the organic carbon content in soil. Cover crops in between rows
(inter-row) of fruit plantations improve physical and chemical properties of
soil (2, 35). In semiarid climate, the
practice also prevents fruits from becoming sunburnt (26). In the Argentina provinces of Rio Negro and Neuquén,
plant species such as Festuca arundinacea, F. rubra, Trifolium
pratense, T. repens, Lolium perenne and Vicia sativa are
the most common cover crops used by growers (35).
However, some farmers maintain their inter-row with spontaneous vegetation or
bare soil.
Vegetation cover
returns carbon to the soil from above-and below-ground biomass. Root-derived
carbon has a longer residence time in soil than carbon derived from above-ground
biomass (28). Roots contribute to a more
stable carbon source (20) and increase
soil carbon sequestration, which is an important aspect of sustainable farming system.
Plant functional type regulates the vertical distribution of soil organic carbón
(19). Root system morphology controls the
availability of soil organic carbon and phosphorus (31,
39) and the vertical distribution of nematodes in the soil (33). Soil fauna depends on carbon resources
through the complex interactions between the roots and microorganisms (5). Microbivore nematode biomass is correlated
with levels of soil carbón (41) and
nematodes have also been shown to increase microbial turnover and soil N and P availability,
increasing plant biomass production (16).
The type of plant species present in the community, rather than the diversity
of the community itself, can produce multitrophic effects on the soil food web
(37). Winter cover crops, such as Hordeum
vulgare and Pisum sativum, as well as Fabaceae species have been
shown to increase soil food web complexity (9, 21).
Both the use of cover crops and the incorporation of crop straw have been shown
to enhance nematodes biomass, thus facilitating carbon flow into the soil food
web (41).
Previous studies
on fruit orchards have focused on how the introduction of cover crops affects
the nematode assemblage in different crops such as apple (30), vineyards (27),
and banana (9). However, relatively
little study has been conducted on soil carbon content and nematode assemblages
in vegetation-covered inter-rows and vegetation-free tree rows maintained with
herbicide. The present study contributes to current the understanding of how
using of different long-term vegetation covers in the inter-rows of pear
orchards can affect carbon flow within soil food webs. The objectives of this
study were to 1) describe the relationships between nematode assemblages and
the edaphic properties of the soil profile; 2) assess soil food web conditions
and 3) determine the magnitude of the metabolic footprints of nematode trophic
groups in a pear orchard.
Materials
and Methods
Description
of the study area and soil sampling
The study was
conducted in a commercial pear orchard (38°51’15.7” S, 68°02’46.8” W) in the
province of Río Negro, Argentina. The region has a mild continental and arid
climate. The moisture regime is aridic and the temperature regime is thermic.
The average temperature of the warmest month (January) is 21.9°C while the
coldest month (July) averages 5.7°C. The annual average precipitation is 224
mm. Soil belongs to the Aridisol orden and is classified as Typic Acuicambid (34) with a clay loam texture at 0-20 cm (about
80% silt + clay) and silty clay loam at 20-40 cm depth.
The study was
conducted in an 18-year-old pear orchard (Pyrus communis L.cv
Williams) where tree spacing was 4 x 2 m (1200 pear tree ha-1). Inter-rows (i)
and rows (r) in three plots were studied. The inter-row of each plot was
maintained with different vegetation cover: 1) Medicago sativa L. plus
grasses; (MG), 2) Festuca arundinacea; (FE), and 3) spontaneous
vegetation; (SV). The pear rows were maintained without weeds with the
application of herbicide. Soil samples from six treatments (MGr, SVr, FEr, MGi,
SVi, FEi) and five replicates (sites) were randomly collected to assess soil
properties and nematode assemblages at 0-20 and 20-40 cm depth. Each treatment
was identified according to the inter-row cover of each plot. Composite soil
samples of eight random sub-samples per each combination of treatment by site
(n=30) and depth were collected with a soil auger (2.5 cm diameter). In each
row, soil samples were taken from an area of 1 x 3 m under a selected pear tree
(0.50 m and 1.50 m on both sides of a pear tree, both transversely and
longitudinally to the tree rows, respectively). In each inter-row, soil samples
were taken from an area similar to the row at a distance of about 1.50 m from
the trunk of the selected tree from each row. Soil samples were taken in spring
and autumn, from November 2012 to December 2014. The sampling dates for the FE
and SV plots were as follows: the 9th of November 2012, the 30th of April and
the 12th of November 2013, and the 23rd of April and the 18th of November 2014.
The MG plot was sampled on the following dates: the 22nd of November 2012, the
20th of May and the 11th of December 2013, and the 28th of May and the 1st of
December 2014.
Each plot was
irrigated by flooding. Inter-row soil with MG (MGi) was seeded in 2004 with
alfalfa (40kg ha-1) and fescue (40kg ha-1). Throughout the study, the inter-row
soil was covered by 30% alfalfa, 40% Cynodon dactylon and 30% F.
arundinacea plus Plantago lanceolata. Fescue inter-row (FEi) was
seeded in 2005. At the time of the study, the vegetation cover of the FEi was
fescue and 10% Cynodon dactylon. Plant species composition in the SV
inter-row (SVi) was 45% C. dactylon and 21% Trifolium repens. Of
the remaining plants (34%), a mix of Taraxacum officinale, Trifolium
pratense, Cichorium intybus, P. lanceolata, Lactuca serriola, Polygonum
aviculare and Sonchus oleraceus were recorded. The inter-row was
seeded to a width of 3 m starting at 0.50 m from the trunk of each pear tree.
Vegetation cover was mowed three or four times during summer (2012-13,
2013-14), and the clippings were left on the soil surface to decompose. Part of
the above-ground plant biomass was collected in a 1 x 1 m quadrant in the
inter-row space of each treatment. Shoots and leaves were dried in an oven at
60°C to a constant weight to determine dry matter production. Tree rows were
managed according to the traditional practices employed by growers in this
region. In each growing season, trees were fertilized in spring at 100 units of
nitrogen per hectare, half in October-November and half in December. In autumn,
fertilization was completed with 15 units of nitrogen per hectare. Fertilizers
were applied in the tree rows, including ammonium sulfate, solMIX, phosphoric acid
and diammonium phosphate. Herbicides were used to achieve weed control. For
each growing season, 1,1’-dimethyl-4-4’-bipyridinium dichloride was applied 2-3
times at a rate of 3.5 L ha-1 in spring and glyphosate was applied 4-5 times in
summer at a rate of 4 L ha-1.
Soil
physicochemical and nematode analyses
Soil organic
carbon (SOC) was determined by wet oxidation (K2Cr2O7). Soil salinity was
measured from the extracted saturation and expressed as electrical conductivity
(EC). Sodicity was expressed as exchangeable sodium percentage (ESP).
Exchangeable potassium (K) and sodium were measured with a flame spectrometer
after exchange with ammonium acetate. Available phosphorus (P) in soil was
determined by the Olsen method. Total nitrogen was measured using the Kjeldahl
method only at the first time of sampling at 0-20 cm depth.
Soil nematodes
were extracted from 100 g of fresh soil using centrifugal-flotation (6). Soil moisture was determined gravimetrically
by drying the samples at 105°C for 24 h. Nematode counts for each taxon were
adjusted to the number of nematodes per 100 g of dry soil. The recovered
nematodes were counted and preserved in formalin. At least 100 specimens from
each sample were randomly selected and identified to genus or family level to
be assigned to five trophic groups: bacterivores, fungivores, obligate plant
feeders, facultative plant feeders, and omnivores-predators according to Yeates et al. (1993). The abundance of nematode
trophic groups and the trophic diversity index (T = 1/Σpi 2, pi is the
proportion of the trophic group i in nematode assemblage) were
calculated to describe the nematode assemblage. The enrichment index (EI),
structure index (SI) and, channel index (CI) were calculated to assess the
condition of the soil food web according to Ferris et
al. (2001). Nematode biomass and metabolic footprints were calculated
using NINJA´s on-line web application (32).
Metabolic footprint informs on the ecological function undertaken by nematodes
(14).
Statistical
analyses
Analysis of
variance of a linear mixed model was employed to compare the fixed effects of
treatment and season on soil physicochemical data, nematode abundance,
ecological indices, and metabolic footprints using the statistical software Infostat
(2020). Each soil depth was investigated separately. A random effect was
included to model the variability of sites within the plots. Differences
obtained at the p < 0.05 level were considered significant using the
LSD Fisher test. An analysis of variance was performed to test for differences
in dry matter production per cover. Principal component analysis (PCA) was
performed to explore the relationship between nematode trophic groups and soil
physicochemical properties under different treatments and depths. A Pearson’s
correlation analysis was performed to quantify the association between SOC and
biomass of nematode assemblage in the row and the inter-row in the 0-40 cm soil
profile using Infostat (2020).
Results
Soil
physicochemical properties and plant dry matter production
At 0-20 cm
depth, SOC was higher in MGi in spring than in other treatment x season
interactions (table 1). In spring and autumn, SOC was higher
in MGi than in MGr. The value of total N in MGi was 0.15% and higher than the
other treatments (p<0.01). Available P was higher in the rows and SVi than
in FEi and MGi. Exchangeable K was higher in MGi in spring than in other
treatment x season interactions. The highest values of EC and ESP were obtained
in FEi, and were greater in autumn than in spring. At 20-40 cm depth, SOC was
greater in MGi than under all other treatments which did not vary from each
other. The average EC value was higher in FEi (table 1).
Table
1. Main values of soil properties (±SE) in
six treatments at two depths.
Tabla 1. Valores
medios de las propiedades del suelo (±ES) en seis tratamientos a dos
profundidades.
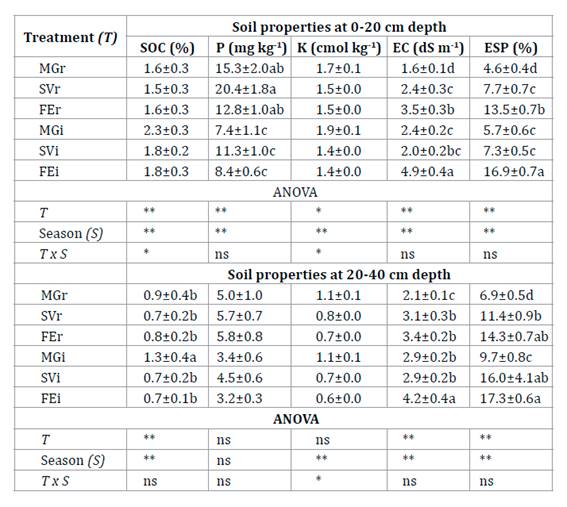
Each treatment was identified according to the
inter-row cover of each plot: Medicago+grasses; MG, spontaneous
vegetation; SV and fescue; FE. r: row and i:
inter-row. SOC: Soil organic carbon, K: Exchangeable potassium, P: Available
phosphorus, EC: Electrical conductivity and ESP: exchangeable sodium
percentage. Different letters in the column indicate significant differences
between treatments for analysis of variance at * P<0.05, ** P<0.01, and
ns: not significant according to Fisher test.
Cada tratamiento fue identificado de acuerdo con la
cobertura del interfilar de cada parcela Medicago+grasses; MG,
vegetación espontánea; SV y festuca FE. r: fila e i:
interfilar. SOC: Carbono orgánico del suelo, K: Potasio intercambiable, P:
Fósforo disponible, EC: conductividad eléctrica, y ESP: porcentaje de sodio
intercambiable. Diferentes letras en la columna indican diferencias
significativas entre tratamientos para el análisis de varianza a * P<0,05,
** P<0,01, y ns: no significativo según la prueba de Fisher.
Plant dry matter
production was higher in the MGi than in other soil covers (p<0.01). The
amount of dry biomass was 14.3, 8.1 y 6.5 t ha-1 for the MG, FE and SV
inter-rows, respectively.
Nematode
abundance
Total nematode
abundance was higher in each inter-row than in its associated row (table
2). At 0-20 cm, bacterivores were most abundant in the rows, whereas
different trophic groups predominated in abundance in the inter-rows. The 20-40
cm layer was generally dominated by obligate plant feeders, followed by
bacterivores.
Table
2. Mean abundance of nematode (individuals
100g-1 dry soil ±SE) in six treatments at two depths.
Tabla 2. Abundancia
media de nematodos (individuos en 100g-1 de suelo seco ±ES) en seis
tratamientos a dos profundidades.
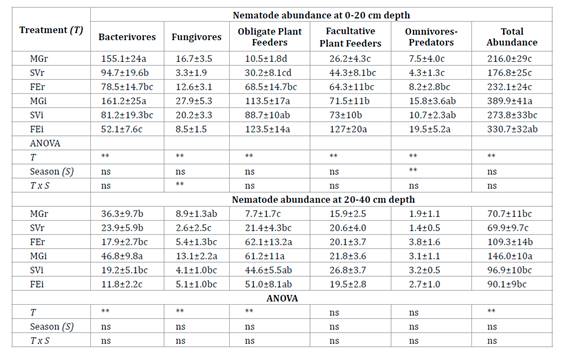
Each treatment was identified according to the
inter-row cover of each plot: Medicago+grasses; MG, spontaneous
vegetation; SV and fescue; FE. r: row and i:
inter-row. Different letters in the column indicate significant differences
between treatments. Significance levels: *P<0.05, **P<0.01, and ns: not
significant according to Fisher test.
Cada tratamiento fue identificado de acuerdo con la
cobertura del interfilar de cada parcela Medicago+grasses; MG,
vegetación espontánea; SV y festuca FE. r: fila e i:
interfilar. Diferentes letras en la columna indican diferencias significativas
entre tratamientos. Niveles de significancia: *P<0,05, **P<0,01, y ns: no
significativo según la prueba de Fisher.
At 0-20 cm depth
the abundance of bacterivores was higher in MGi and MGr than in other
treatments (table 2). The abundance of fungivores was higher
in MGi and SVi. The population density of obligate plant feeders did not vary
between MG, SV and FE inter-rows. The highest density of facultative plant
feeders was observed in FEi and was higher in each inter-row than its
associated row. The population density of omnivore-predators was greater in the
inter-rows than in the rows, and greater in spring than in autumn. The
abundance of bacterivores at 20-40 cm depth showed a similar trend as at 0-20
cm depth (table 2). The abundance of fungivores was higher in
MGi and MGr. Obligate plant feeders were more abundant in the inter-rows and
FEr.
Linking
the nematode assemblage with soil physicochemical properties
An exploratory
PCA showed the relationships between the nematode assemblage and soil
properties in different treatments and soil profiles (figure 1).
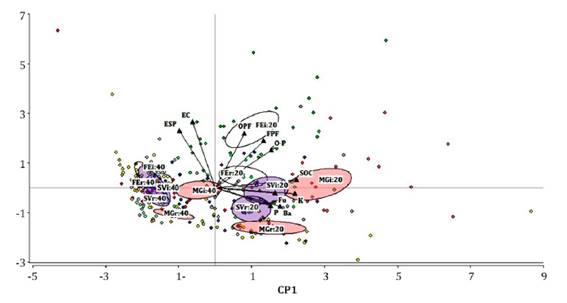
Confidence ellipses around each treatment are shown:
MGr20 and MGi20: row and inter-row of plot with Medicago+grasses cover at
0-20 cm. SVr20 and SVi20: row and inter-row of plot with spontaneous vegetation
cover at 0-20 cm. FEr and FEi: row and inter-row of plot with fescue cover at
0-20 cm. The same references are repeated to 20-40 cm depth. SOC: Soil organic
carbon, K: Exchangeable potassium, P: Available phosphorus, EC: Electrical
conductivity, ESP: exchangeable sodium percentage, Ba: Bacterivores, Fu:
Fungivores, OPF: Obligate plant feeders, FPF: Facultative plant feeders, and
O-P: Omnivores-Predators.
Las elipses de confianza se observan por cada
tratamiento: MGr and MGi: fila e interfilar de la parcela con la cobertura Medicago+grasses
a los 0-20 cm. SVr and SVi: fila e interfilar de la parcela con vegetación
espontánea a los 0-20 cm. FEr and FEi: fila e interfilar de la parcela con la
cobertura festuca a los 0-20 cm. Las mismas referencias se repiten para 0-40
cm. SOC: Carbono orgánico del suelo, K: Potasio intercambiable, P: Fósforo
disponible, EC: Conductividad eléctrica, ESP: Porcentaje de sodio
intercambiable, Ba: Bacteriófagos, Fu: Fungívoros, OPF: Fitófagos obligados,
FPF: Fitófagos facultativos y O-P: Omnívoros-Predatores.
Figure 1. Biplot
of principal component analysis based on the soil properties and nematode
trophic groups at two depths.
Figura 1. Gráfico
del análisis de componentes principales sobre las propiedades del suelo y los
grupos tróficos de nematodos a dos profundidades.
The first two
principal components, PC1 (36.4%) and PC2 (17.1%), explained 53.5% of the
variance. PC1 was strongly and positively correlated with SOC, K, and the
abundance of bacterivores and fungivores. PC2 was positively correlated with
the abundance of obligate plant feeders, EC and ESP. A grouping pattern
according to soil depth can be observed along the PC1 axis. The nematode assemblage
was generally different among treatments at 0-20 cm depth. In contrast, at
20-40 cm, a clustering pattern between FE and SV inter-rows and rows was
observed.
Nematode
community indices, biomass and metabolic footprints of soil nematodes
At 0-20 cm
depth, EI was higher in MGr and MGi (table 3). In general, SI
was higher in each inter-row compared to its row. CI was higher in SVi than in
the other inter-rows. At 20-40 cm depth the values of EI, SI, and CI did not
vary between treatment and season (table 3).
Table 3. Mean
values of nematode indices (±SE) in six treatments at two depths.
Tabla 3. Valores
promedio de los índices de nematodes (±ES) en seis tratamientos a dos
profundidades.
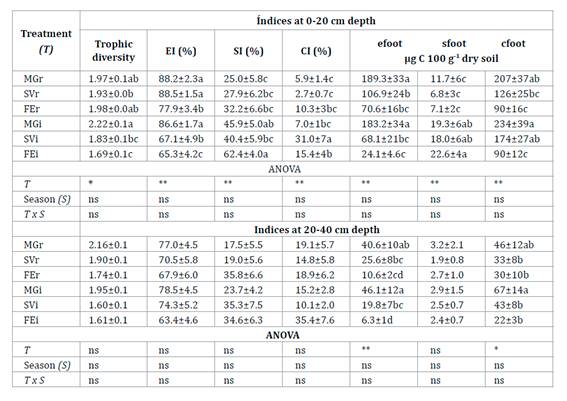
Each treatment was identified according to the
inter-row cover of each plot: Medicago+grasses; MG, spontaneous
vegetation; SV and fescue; FE. r: row and i:
inter-row. EI: enrichment index, SI: Structure index. CI: Channel index, efoot:
enrichment footprint, sfoot: structure footprint, and cfoot: composite
footprint. Different letters in columns indicate significant differences
between treatments. Significance levels: *P<0.05, **P<0.01, and ns: not
significant according to Fisher test.
Cada tratamiento fue identificado de acuerdo con la
cobertura del interfilar de cada parcela Medicago+grasses; MG,
vegetación espontánea; SV y festuca FE. r: fila e i:
interfilar. EI: Índice de enriquecimiento, SI: Índice de estructura, CI: Índice
canal, efoot: huella de enriquecimiento, sfoot: huella de estructura, y cfoot:
huella compuesta. Diferentes letras en las columnas indican diferencias
significativas entre tratamientos. Niveles de significancia: *P<0,05,
**P<0,01, y ns: no significativo según la prueba de Fisher.
In the 0-40 cm
soil profile, the biomass of nematode assemblage showed a positive correlation
with the content of SOC in the row (r=0.48, p<0.01) and in the inter-row
(r=0.46, p<0.01). At 0-20 cm depth, nematode composite footprint was higher
in MGi and SVi than FEi (table 3). Bacterivores accounted for
the highest metabolic footprint in the rows, while bacterivores and herbivores
were prominent in the inter-rows (figure 2a).
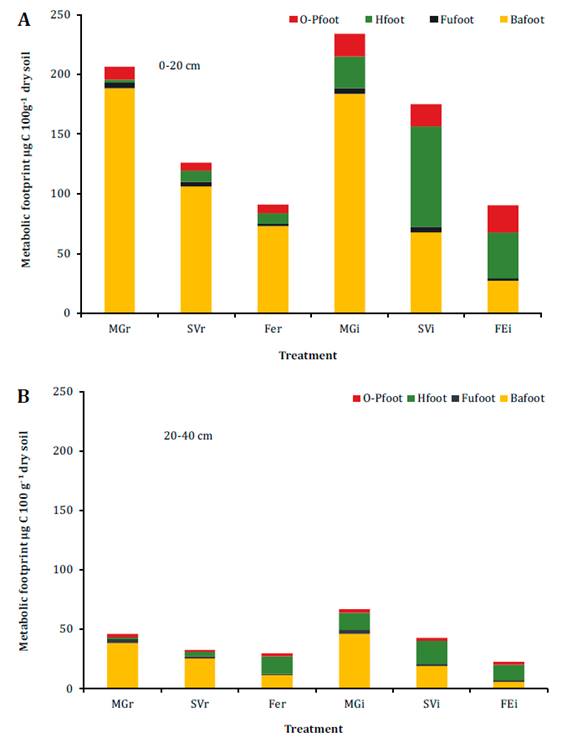
Each treatment was identified according to the
inter-row cover of each plot: Medicago+grasses; MG, spontaneous
vegetation; SV and fescue; FE. r: row and i:
inter-row. Ba: Bacterivores, Fu: Fungivores, H: Herbivores, and O-P: Omnivores-
Predators.
Cada tratamiento fue identificado de acuerdo con la
cobertura del interfilar de cada parcela: Medicago+grasses; MG,
vegetación espontánea; SV y festuca FE. r: fila e i:
interfilar. Ba: Bacteriófagos, Fu: Fungivoros, H: Herbívoros, y O-P:
Omnívorospredatores.
Figure 2. Metabolic
footprint (foot) of nematode trophic groups in six treatments at (A) 0-20 and
(B) 20-40 cm depths.
Figura 2. Huella
metabólica (foot) de los grupos tróficos de nematodos en seis tratamientos a
las profundidades (A) 0-20 y (B) 20-40 cm.
Bacterivore
footprint was higher in MGi and MGr than in the other treatments (p<0.01).
Herbivore footprint was highest in SVi (p<0.01, figure 2a)
and was greater in the inter-rows than in the rows (p<0.01). MGi and MGr
were associated with a higher enrichment footprint (table 3).
Structure footprint was higher in the inter-row tan in its associated row. At
20-40 cm depth, composite footprint was higher in MGi than in the other
inter-rows, while it was similar among rows (table 3).
Herbivore footprint did not vary among inter-rows (p<0.03, figure
2b). MGi and MGr were associated with a higher enrichment footprint (table 3).
Discussion
Soil
physicochemical properties and nematode assemblages at different soil depths
Vegetation cover
significantly impacted soil organic carbon levels in the studied pear orchard. Medicago+grasses-covered
inter-rows exhibited SOC levels that were 22% and 46% higher at depths of 0-20
and 20-40 cm, respectively, than other covers at those depths. SOC provides
resources for soil biota (31, 41) and
this may be reflected by the positive association seen between soil carbon and
nematode biomass in the soil profile. Stratification of SOC is common in
agroecosystems (17). In MGi, the
stratification of SOC was less noticeable than in the SV and FE inter-rows.
Plant functional types and architectural root characteristics regulate the
vertical distribution of soil organic matter (19).
Vegetal species such as Medicago sativa, which has a vigorous root
system in deep soil, contribute to carbon storage in the soil profile because
the carbon produced by roots forms stable organo-mineral associations (20). In the present study, maintaining a
permanent cover with MGi in springtime resulted in a higher level of SOC in the
soil profile compared to MGr. Interestingly, this increase in organic matter
-evidently brought about by MG cover- coincided with the period when new pear
roots are developed, thus ensuring that nutrients are available for fruit crop
uptake.
Total nematode
abundance showed a differential distribution between the soil layers; about 75%
of all nematodes recorded at 0-40 cm depth were recovered from the top 0-20 cm.
This differential distribution pattern applies to both inter-rows and rows
alike. Previous studies have shown a similar trend (31,
39). Total nematode abundance was generally greater in inter-rows
than in rows at a depth of 0-20 cm (table 2). In the
inter-row of each plot, populations of fungivores, facultative and obligate
plant feeders, and omnivores-predators were seen in greater abundance than in
the row. Using herbicides to control weeds in the pear row could alter the
nematode assemblage. Seedling emergence and root length were reduced by
application glyphosate on pre-existing vegetation (29).
The loss of plants due to weeding may result in a loss of food resources,
thereby affecting several trophic groups (25).
Environmental
and edaphic factors shape spatial heterogeneity of soil according to land use
and root distribution (24). Nematode
assemblages will therefore differ depending on resource availability and soil
spatial heterogeneity along the depth gradient (13).
In the topsoil, each inter-row recorded different nematode assemblages that
were associated with particular edaphic properties. In MGi, bacterivore
nematodes dominated in a non-saline soil with the highest content of SOC, total
N and exchangeable K, which is in line with other studies in Fabaceae crops (9, 37). Bacterivores are attracted by the
volatile compounds released by legume roots, which lead to the spread of
bacteria and improve rhizobial inoculation (18).
In the present study, total soil N supply was 30% higher under Medicago+grasses
cover tan any other cover. Nearby trees can capture this inter-row nitrogen.
The pear tree develops roots with a greater exploratory capacity when grafted
on rootstock, and these roots exceed the canopy´s projection on the ground,
this allows the plant to capture the available nitrogen in the inter-row. In
SVi, obligate plant feeders and bacterivores were similar in abundance and were
the most abundant groups. The highest plant species richness and available P
content in non-saline soil were associated with nematode assemblages´ trophic
structure. Floristic diversity has a potential role in soil P input due to a
differential accumulation of P in each plant (23), which contributes
to an increasing this nutrient of limited mobility in the soil profile. In the
present study, P was probably released by the decomposition of plant residues
from vegetation that was mown over the summer. Furthermore, frosts in Winter
and spring are common in the study region and cause the death of shoot and root
cells, releasing intracellular P (22). In
FEi, obligate and facultative plant feeders were found to be the most abundant
groups in slightly saline and sodic soil. The index of nematode trophic diversity
recorded its lowest value in this treatment compared to other treatments. This
finding concurs with Su et al. (2016), who
found a sensitivity of this nematode trophic group to slightly saline soils.
For a detailed view of the composition of soil nematode plant feeders see Azpilicueta et al. (2017).
In the
sub-superficial soil, in the inter-rows of SV and FE, obligate plant feeders
dominated, while in the pear rows, plant feeders and bacterivores prevailed in
saline and sodic soil. A previous study on a pear orchard observed that plant
feeders were the most abundant trophic group in saline and slightly sodic soil
(3). In the valleys of Río Negro and
Neuquén, about 40% of soils from fruit orchards have a shallow water table,
which impacts the salinization process of soil (15)
because the water table fluctuates to different depths during the crop growing
season (1).
Soil
food web condition
In the topsoil,
the higher enrichment index (EI) found in the MGi suggests a more enriched
condition of the soil food web than in the SV and FE inter-rows. A positive
relationship between EI and quantity of cover crop biomass was found by Dupont et al. (2009). In the present study,
plant dry matter production was ca. two times
higher in the MGi than in the other inter-rows. The return of plant residues to
the soil contributes to the availability of basal resources for primary
decomposers in the soil food web (38).
This was reflected in the fact that the highest bacterivore and fungivore
abundance observed in our study was recorded in MGi. These trophic feeding
groups have shown to be first responders to resource enrichment (41).
Microbivore
nematodes are at the base of the soil food web and drive energy flow to the
higher trophic groups into the bacterial or fungal energy channel. The channel
index values were less than 30% in the inter-rows and rows, indicating that the
bacterial channel was dominant compared to the fungal channel (12). The magnitude of soil energy channels can be
estimated using both biomass and metabolic footprint attributes (7, 14). The bacterivore metabolic footprint was
higher in MGi than in SVi and FEi in the soil profile. Furthermore, the
bacterivore footprint represented 70% of the composite footprint, indicating
that the highest carbon assimilation in the soil food web occurred through
bacterial channels. Another soil energy channel is mediated by plant feeding
and involves live roots. Herbivore footprints were higher in the inter-rows
than in the rows, particularly in SVi, which could reflect the heterogeneity of
resources due to greater vegetation diversity. Plant species identity has
relevance in controlling energy channels in soil systems (7).
Structure index
and footprint were low to moderate across all treatments; consequently, the
magnitude of pest suppression performed by omnivores-predators was low. Due to
the high content of fine particles, the movement and reproduction of
omnivores-predators could be affected by granulometric soil composition. In
addition, the predominance of small pores could reduce the abundance of the
largest nematodes in the soil profile (33).
Even so, SI and sfoot were higher in the inter-rows than in the rows,
suggesting a more complex nematode assemblage with more linkages in the food
web in the inter-rows. The inter-rows with vegetation covers were reservoirs of
omnivores-predators, which can regulate lower soil food web levels, including
plant-feeders. The structure footprint was lower than the enrichment footprint
in both rows and inter-rows. According to Ewald et al.
(2020), food webs in arable systems have low productivity and high resource
input. The mineralization service given by the enrichment footprint was higher
in MGi and MGr. The excretory products of nematodes, such as amino acids, NH4 +
and PO4 -3 increase soil nutrient availability (16),
and they may improve the growth and production of fruit and cover crops.
Conclusions
This study has
enhanced the current knowledge of carbon flow in the soil food web in the
inter-rows and rows of a pear orchard. Bacterial channels prevailed in the
rows, while different energy channels were found in the inter-rows. The
relative magnitude of soil energy channels revealed higher carbon flow within
the soil food web under Medicago+grasses and spontaneous vegetation than
under fescue. The herbivore energy channel made a significant contribution
under spontaneous vegetation.
Our data suggest
that nutrient mineralization was greater in inter-rows and rows in the Medicago+grasses
plot. Moreover, a higher soil carbon content was seen in the inter-row under Medicago+grasses,
and this treatment also yielded a higher abundance of bacterivores and fungivores
in the soil profile, and was thus seen to have an impact on soil fertility.
Each cover crop
was associated with a different nematode assemblage due to their particular
edaphic properties, mainly in the topsoil. Nematode biomass was positively
correlated with soil carbon content. The abundance of omnivores-predators
associated with the structure of soil food web was greater in the inter-rows
than in the rows. Consequently, pear rows with disturbed soil food webs could
be improved with the assistance of nematodes from associated inter-rows. Taken
together, these findings suggest that adequate soil management in inter-rows
may promote the abundance of beneficial nematodes and improve the productive
capacity of pear trees.
1. Apcarian, A.;
Schmid, P.; Aruani, M. 2014. Suelos con acumulaciones calcáreas y yesíferas en
el Alto Valle de Río Negro. Patagonia Norte. En: Imbelone, P. (Ed.). Suelos con
acumulaciones calcáreas y yesíferas en Argentina. Buenos Aires. Argentina.
INTA. 149-182.
2. Aruani, M.;
Sánchez, E.; Reeb, P. 2006. Cambios en las propiedades de un suelo franco bajo
producción orgánica de manzano utilizando coberturas vegetales. Revista
Argentina de la Ciencia del Suelo 24: 131-137.
3. Aruani, M.;
Azpilicueta, C.; Reeb, P.; Arias, M. 2017. Ensamble de nematodos en una
cronosecuencia en suelo salino y fertilizado en un huerto frutícola. Revista
Argentina de la Ciencia del Suelo. 35: 47-55.
4. Azpilicueta,
C.; Aruani, M.; Morales, J. 2017. Efecto del tipo de cobertura vegetal en el
espacio entre hileras de perales sobre la abundancia de nematodos fitófagos.
Revista Facultad de Agronomía. La Plata. 116: 249-257.
5. Bonkowski,
M.; Cheng, W.; Griffiths, B.; Alphei, J.; Scheu, S. 2000. Microbial-faunal
interactions in the rhizosphere and effects on plant growth. 2000. European
Journal of Soil Biology. 36: 135-147. DOI: 10.1016/S1164-5563(00)01059-1
6. Caveness, F.;
Jensen, H. 1955. Modification of the centrifugal-flotation technique for the
isolation and concentration of nematodes and their eggs from soil and plant
tissue. Proceedings of the Helminthological Society of Washington. 22: 87-89.
7. Ciobanu, M.;
Popovici, I.; Zhao, J.; Stoica, I. 2015. Patterns of relative magnitudes of
soil energy channels and their relationships with environmental factors in
different ecosystems in Romania. Scientific Report. 5: 17606. DOI:
10.1038/srep17606
8. Di Rienzo,
J.; Casanoves, F.; Balzarini, M.; González, L.; Tablada, M.; Robledo, C.
InfoStat versión 2020. Grupo InfoStat. FCA. Universidad Nacional de Córdoba.
Argentina.
9. Djigal, D.;
Chabrier, C.; Duyck P.; Achard, R.; Quénéhervé P.; Tixier, P. 2012. Cover crops
alter the soil nematode food web in banana agroecosystems. Soil Biology &
Biochemistry 48: 142-150. DOI: 10.1016/j.soilbio.2012.01.026
10. Dupont, S.;
Ferris, H.; Horn, M. 2009. Effects of cover crop quality and quantity on
nematode-based soil food webs and nutrient cycling. Applied Soil Ecology. 41:
157-167. DOI:10.1016/j.apsoil.2008.10.004
11. Ewald, M.;
Glavatska, O.; Ruess, L. 2020. Effects of resource manipulation on nematode
community structure and metabolic footprints in an arable soil across time and
depth. Nematology. 22: 1025-1043. DOI: 10.1163/15685411-bja10009
12. Ferris, H.;
Bongers, T.; De Goede, R. 2001. A framework for soil food web diagnostics:
Extension of the nematode faunal analysis concept. Applied Soil Ecology. 18:
13-29. DOI:10.1016/S0929-1393(01)00152-4
13. Ferris, H.;
Bongers, T. 2006. Nematode indicators of organic enrichment. Journal of
Nematology. 38: 3-12.
14. Ferris, H. 2010.
Form and function: Metabolic footprints of nematodes in the soil food web. European Journal
of Soil Biology . 46: 97-104. DOI:10.1016/j.ejsobi.2010.01.003
15. Galeazzi,
J.; Alvarez, O. 1998. Determinación de áreas afectadas por niveles freáticos
críticos en el Alto Valle de Río Negro. Congreso Latinoamericano y Argentino de Ingeniería Rural. La Plata. Argentina.
16. Gebremikael,
M.; Steel, H.; Buchan, D.; Bert, W.; De Neve, S. 2016. Nematodes enhance plant
growth and nutrient uptake under C and N-rich conditions. Scientific Reports.
6: 32862. DOI: 0.1038/srep32862www
17. Hernanz, J.;
Sánchez-Guirón, V.; Navarrete, L. 2009. Soil carbon sequestration and
stratification in a cereal/leguminous crop rotation with three tillage systems
in semiarid conditions. Agriculture, Ecosystems and Environment. 133: 114-122.
DOI:10.1016/j.agee.2009.05.009
18. Horiuchi,
J.; Prithiviraj, B.; Bais, H.; Kimball, B.; Vivanco, J. 2005. Soil nematodes
mediate positive interactions between legume plants and rhizobium bacteria. Planta.
222: 848-857.
19. Jobbágy, E.;
Jackson, R. 2000. The vertical distribution of soil organic carbon and its
relation to climate and vegetation. Ecological Applications. 10: 423-436. DOI:10.2307/2641104
20. Kätterer,
T.; Bolinder, M.; Andrén, O.; Kirchmann, H.; Menichetti, L. 2011. Roots
contribute more to refractory soil organic matter than aboveground crop
residues, as revealed by a long-term field experiment. Agriculture Ecosystems
and Environment. 141: 184-192. DOI:10.1016/j.agee.2011.02.029
21. Leslie, A.;
Wang, S.; Meyer, S.; Marahatta, S.; Hooks, C. 2017. Influence of cover crops
and arthropods, free-living nematodes, and yield in a succeeding no-till
soybean crop. Applied Soil Ecology. 117-118: 21-31.
DOI:10.1016/j.apsoil.2017.04.003
22. Liu, J.;
Khalaf, R.; Ulén, B.; Bergkvist, G. 2013. Potential phosphorus release from
catch crop shoots and roots after freezing-thawing. Plant & Soil. 371:
543-557.
23. Nolla, A.;
Jucksh, I.; Castaldo, J.; Alvarenga, R.; Albrecht, L. 2018. Growth and
accumulation of nutrients by weeds, in maize and legumes intercrops. Planta
Daninha. 36: 1-11. DOI:10.1590/s0100-83582018360100096
24. Ou, W.;
Liang, W.; Jiang, Y.; Li, Q.; Wen, D. 2005. Vertical distribution of soil
nematodes under different land use types in an aquic brown soil. Pedobiologia.
49: 139-148. DOI:10.1016/j.pedobi.2004.10.001
25. Parfit, R.;
Yeates, G.; Ross, D.; Schon, N.; Mackay, A.; Wardle, D. 2010. Effect of
fertilizer, herbicide and grazing management of pastures on plant and soil
communities. Applied Soil Ecology. 45: 175-186.
DOI:10.1016/j.apsoil.2010.03.010
26. Raffo
Benegas, M.; Rodríguez, A. 2007. Factores que afectan el porcentaje de fruta
asoleada en manzanos cv. Fuji en el Alto Valle de Río Negro y Neuquén. RIA. 36:
31-146.
27. Rahman, L.;
Whitelaw-Weckert, M.; Hutton, R.; Orchard, B. 2009. Impact of floor vegetation
on the abundance of nematode trophic groups in vineyards. Applied Soil Ecology.
42: 96-106. DOI:10.1016/j.apsoil.2009.02.006
28. Rasse, D.;
Rumpel, C.; Dignac, M. 2005. Is soil carbon mostly root carbon? Mechanisms for
a specific stabilisation. Plant & Soil. 269: 341-356. DOI -
10.1007/s11104-004-0907-y
29. Rodríguez,
A. M.; Jacobo, E. J.; Grimoldi, A. A.; Golluscio, R. A. 2022. Glyphosate
sprayed on the pre-existing vegetation reduces seedling emergence and growth of
forage species. Revista de la Facultad de Ciencias Agrarias. Universidad
Nacional de Cuyo. Mendoza. Argentina. 54(1): 35-45
DOI:
https://doi.org/10.48162/rev.39.063.
30. Sánchez, E.;
Giayetto, A.; Cichón, L.; Fernández, D.; Aruani, M.; Curetti, M. 2007. Cover
crops influence soil properties and tree performance in an organic apple (Malus
domestica Borkh) orchard in northern Patagonia. Plant and Soil. 292:
193-203. DOI:10.1007/s11104-007-9215-7
31. Scharroba,
A.; Kramer, S.; Kandeler, E.; Ruess, L. 2016. Spatial and temporal variation of
resource allocation in an arable soil drives community structure and biomass of
nematodes and their role in the micro-food web. Pedobiology. 59: 111-120.
DOI:10.1016/j.pedobi.2016.03.005
32.
Sieriebriennikov, B.; Ferris, H.; de Goede, R. 2014. NINJA: an automated
calculation system for nematode-based biological monitoring. European Journal
of Soil Biology . 61: 90-93. DOI:10.1016/j.ejsobi.2014.02.004
33. Sohlenius,
B.; Sandor, A. 1987. Vertical distribution of nematodes in arable soil under
grass (Festuca pratensis) and barley (Hordeum distichum). Biology
& Fertility of Soils. 3: 19-25.
34. Soil Survey
Staff. 2014. Keys to Soil Taxonomy. 12th ed. USDA. Natural Resources
Conservation Service, Washington. DC. USA.
35. Sozzi, G.
2007. Árboles frutales. Ecofisiología, cultivo y aprovechamiento. Editorial
Facultad de Agronomía. Universidad de Buenos Aires. Argentina. 803 p.
36. Su, Y.; Liu,
T.; Wang, X.; Yang, R. 2016. Salinity effects on soil organic carbon and its
labile fractions and nematode communities in irrigated farmland in an arid
region, northwestern China. Science in Cold and Arid Regions. 8: 47-53.
DOI:10.3724/SP.J.1226.2016.00046
37. Viketoft,
M.; Bengtsson, J.; Sohlenius, B.; Berg, M.; Petchey, O.; Palmborg, C.;
Huss-Danell, K. 2009. Long-term effects of plant diversity and composition on
soil nematode communities in model grasslands. Ecology. 90: 90-99.
DOI:10.1890/08-0382.1
38. Wardle, D.;
Yeates, G.; Bonner, K.; Nicholson, K.; Watson, R. 2001. Impacts of ground
vegetation management strategies in a kiwifruit orchard on the composition and
functioning of the soil biota. Soil Biology & Biochemistry. 33: 893-905.
DOI: 10.1016/S0038-0717(00)00235-2
39. Yeates, G.
1980. Population of nematode genera in soils under pasture. III: Vertical
distribution at eleven sites. N. Z. Journal of Agricultural Research. 23:
117-128. DOI: 10.1080/00288233.1980.10417855
40. Yeates, G.;
Bongers, T.; De Goede, R.; Freckman, D.; Georgieva, S. 1993. Feeding habits in
soil nematode families and genera - An outline for soil ecologists. Journal of
Nematology. 25: 315-331.
41. Zhang, X.;
Ferris, H.; Mitchell, J.; Liang, W. 2017. Ecosystem services of the soil food
web after long-term application of agricultural management practices. Soil
Biology & Biochemistry. 111: 36-43. DOI:10.1016/j.soilbio.2017.03.017