Revista de la Facultad de Ciencias
Agrarias. Universidad Nacional de Cuyo. Tomo 55(2). ISSN (en línea) 1853-8665.
Año 2023.
Original article
Apple (Malus domestica) and pear (Pyrus communis) yield
prediction after tree image analysis
Detección
de manzanas (Malus domestica) y peras (Pyrus communis) a partir
de imágenes para pronósticos de producción
Valentin Tassile3,
Sergio Jorge Bramardi2,
Darío Eduardo Fernández1,
Pablo Daniel Reeb2
1Estación experimental Ing. Agr. Carlos H Casamiquela. Instituto
Nacional de Tecnología Agropecuaria. Ruta Nacional 22. km 1190. C.
P. 8328. Allen. Rio Negro.
2Universidad Nacional del Comahue. Departamento de Estadística.
Buenos Aires 1400. C. P. 8300. Neuquén. Capital.
3Universidad
Nacional del Comahue. Facultad de Ciencia y Tecnología de los Alimentos. 25 de
Mayo y Reconquista. C.
P. 8336. Villa Regina. Río Negro.
*delbrio.dolores@inta.gob.ar
Abstract
Yield forecasting depends on accurate tree fruit counts and mean size
estimation. This information is generally obtained manually, requiring many
hours of work. Artificial vision emerges as an interesting alternative to
obtaining more information in less time. This study aimed to test and train
YOLO pre-trained models based on neural networks for the detection and count of
pears and apples on trees after image analysis; while also estimating fruit
size. Images of trees were taken during the day and at night in apple and pear trees while fruits were manually counted. Trained
models were evaluated according to recall, precision and F1score. The
correlation between detected and counted fruits was calculated while fruit size
estimation was made after drawing straight lines on each fruit and using
reference elements. The precision, recall and F1score achieved by the models
were up to 0.86, 0.83 and 0.84, respectively. Correlation coefficients between
fruit sizes measured manually and by images were 0.73 for apples and 0.80 for
pears. The proposed methodologies showed promising results, allowing
forecasters to make less time-consuming and accurate estimates compared to
manual measurements.
Keywords: Fruit detection, Artificial
visión, Yield forecast, Malus domestica, Pyrus communis
Resumen
Para pronosticar la
producción es necesario contar el número de frutos de los árboles y estimar el
tamaño medio. Esta información se obtiene manualmente y requiere mucha mano de
obra experimentada. La visión artificial surge como alternativa para obtener
más información en menos tiempo. Los objetivos del trabajo fueron entrenar
modelos de visión artificial para detectar y contar el número de peras y
manzanas en árboles a partir de imágenes; y medir diámetros de frutos en
imágenes. Se usaron modelos pre-entrenados para detección de objetos basados en
redes neuronales (YOLO). Se tomaron imágenes de árboles de día y de noche, y
los frutos de cada planta fueron contados manualmente. Los modelos se evaluaron
según sensibilidad, precisión y F1score; y se calculó la correlación entre
frutos detectados y contados. La estimación de diámetros se realizó trazando
líneas rectas sobre cada fruto y utilizando elementos de referencia. La
precisión, sensibilidad y F1score alcanzados por los modelos fueron 0,86, 0,83
y 0,84, respectivamente. Las correlaciones entre diámetros medidos manualmente
y por imágenes fueron de 0,73 en manzanas y 0,80 en peras. Las metodologías
propuestas permitieron realizar estimaciones a partir de imágenes con una
precisión aceptable y en menor tiempo respecto de las mediciones manuales.
Palabras clave: Detección de frutos, Visión
artificial, Predicción de cosecha, Malus domestica, Pyrus communis
Originales: Recepción: 05/12/2022
- Aceptación: 02/08/2023
Introduction
Yield prediction constitutes a major challenge in pear and apple
orchards. Early yield forecasts allow growers to estimate final fruit volume,
calculate necessary supplies for fruit picking, plan
and manage storage spaces, book grading facilities and transport (34).
Nevertheless, estimating yield in fruit crops is not easy given that
fruit crops are perennial species in which small variations in cultural
techniques or differences in cultivar genotype define greater production variability
(3). Additionally, annual yield depends
on climatic and management conditions that affect flowering, fruit set, growth
and persistence on the plant until harvest (2).
Furthermore, forecasts are generally based on manual counting of fruit in selected
trees. This method is extremely time-consuming and the number of inspected
trees is generally small, adding inaccuracy (30).
In this scenario, image analysis becomes one crucial alternative.
Image processing techniques in fruit production have increased
significantly in the last few years. Fruit detection after image analysis has
been used for many purposes like yield forecast (1,
9, 11, 30, 34), improvement in thinning decisions (12, 14), and robotic harvesting (23, 32).
Different proximal sensors can be used with computer vision aims (13). Several studies have used simple sensors
like black and white cameras (24), or
more complex multispectral ones (5).
However, most methodologies developed so far, base their analysis on colour
digital images (also called RGB images: Red, Green and Blue). In addition,
image analysis is done after different strategies, from those based on colour
features to modern techniques such as machine learning. Four basic features
characterize objects in images: intensity, colour, shape and texture. All of
them can recognize flowers or fruits. Colour is one of the most important image
features to distinguish fruits from leaves. However, it is affected by
variations in fruit colour, maturity, variety and varying environment (13). In this way, while colour and intensity
analysis is faster, shape analysis is more robust (23).
Some fruit detection algorithms have been solely developed from colour features
(7, 11, 34).
Other more complex algorithms integrate colour, texture and shape features (14, 19, 21, 23, 25, 30).
Nevertheless, machine learning and especially deep learning appears to
be the most promising technique. Many authors suggest that deep learning
achieves better results in image analysis than classical programming methods,
though they require high computational resources (13).
According to Koirala et al. (2019a), computational resources are not a problem anymore, as
having a Graphics Processing Unit (GPU) nowadays turns easy. Free available online
tools consist of graphical annotation apps and last-generation deep learning
models like Faster R-CNN (Faster Regional Convolutional Neural Network) (27), Single Shot MultiBox Detector (SSD) (22), or YOLO (You Only Look Once) (26).
Previous research has trained deep learning models for fruit detection
with promising results in rock melons, strawberries, apples, avocados, mangos,
oranges and sweet pepper (28); apples,
mangos and almonds (4); mangos (18); oranges and apples (8); apples and pears (6,
15); apples in different growth stages (31);
apple fruitlets before thinning (33).
Although fruit detection from image analysis has been studied for a long
time, in the field, variable lighting conditions constitute a disadvantage (23). In addition, fruit detection and
localization are affected by the complex canopy structures (16) and accuracy is limited by the occlusion of
fruits among leaves, branches and other fruits in the image (13). Finally, to the present, only a few studies
conduct fruit detection and counting on pear trees. Also, pear trees, unlike
apple ones, generally have a more complex crown structure and fruits remain
green until they mature. Due to these characteristics, model training needs to
be separately done for each species. This study aimed to i) evaluate deep
learning models for apple and pear detection and counting with yield forecast
purposes, and ii) measure fruit sizes from images.
Materials and methods
Experimental plot
The trial was carried out in two plots at the Instituto Nacional de
Tecnología Agrpecuaria (INTA) Experimental Station, Allen, Argentina
(39°01’33.6’’ S, 67°44’27.8’’ W). Apple cultivar was ‘Red Chief’ grafted on
MM111 rootstock planted in 2000. Trees were trained as espalier at a distance
of 1.5 m between trees by 4 m between rows, in a total area of 0.8 ha, with a
total of 1280 trees. The pear cultivar was ‘Williams Bon Chretien’ grafted on
seedling rootstock and planted in 2003. Trees were trained as espalier, at a
distance of 4 m between rows by 2 m between trees, in a total area of 1.8 ha
with a total of 2016 trees.
Data collection
Images were taken during four seasons from 72 apple trees and 60 pear
trees per season. In the pear plot, 3 trees were randomly selected at 20
representative rows, totalling 60 trees. In the apple plot, 8 trees were
randomly selected from 9 representative rows, totalling 72 trees.
Images were captured when the pears reached an average diameter of 40 mm
and apples 35 mm approximately (first week of December) in two different
conditions: i) natural daylight between 10 am and 1 pm, ii) at night with the
artificial flash light of the camera. Images were captured on a partly cloudy
day to minimize undesirable effects caused by direct sunlight (11). A black curtain was unfolded behind the
trees avoiding interference from neighbouring trees (1).
All images were taken with an RGB digital camera (Cannon of 12 MP) from a
distance of approximately 3.0 m from the tree and transversely to the row. A
square object of 15 cm by 15 cm dimension was placed next to each tree as scale
for size estimations.
The same day, images were captured, and all fruits on each photographed
tree were manually counted by a single operator. Three records were made in
each tree: i) fruit number on the same side of the image; ii) fruit number on
the other side of the image; iii) total fruit number. At harvest time, weight
and number of fruits collected were recorded for each tree. In addition, the
number of apples and pears was visually determined from the fruit images (human
eyes) by the same person.
Fruit detection and counting from image
analysis
The deep learning models trained for fruit detection and counting were
YOLO in different versions: YOLOv5s6 and YOLOv7, available in the github
repository: https://github.com/AlexeyAB/darknet. Pear and apple detection and counting training were done
separately. For apples, the selected version was YOLOv5s6 with an image
resolution of 1024x1024 pixels because YOLOv7 showed a similar performance to
YOLOv5s6, but had a much more complex structure. For pears, the selected
version was YOLOv7 with an image resolution of 1280x1280 pixels because
YOLOv5s6 showed poor performance for this specie. Roboflow was used to label
images with apples or pears categories. The apple dataset had 505 images with a
total of 36260 annotations (fruits) and the pear dataset had 474 images with a
total of 39052 annotations (fruits). Some low-quality images were removed from
the datasets. Each dataset was divided into three parts: training set (70%), validation set (20%) and testing set (10%). Also, to
increase the number of images and generate more information, augmentation
techniques were used in both datasets. Deep-learning-model performance was
evaluated based on: i) precision, which gives the number of true detection out
of total detection, calculated as precision=true positives/(true positives +
false positives); ii) recall, number of true detections out of total truth
annotations, calculated as recall=true positives/(true positives + false
negatives); iii) F1 Score, a weighted average of precision and recall, varying
between 0 (worst) and 1 (best), calculated as F1score=2*(precision*recall/
(precision + recall)), (17).
Pearson correlation coefficients compared model results and manual
counts between i) the number of manually counted fruits on the same side of
image collection; ii) the number of total manually counted fruits in the tree;
iii) the number of labelled fruits in the images (human eye detection in
images); iv) the number of detected fruits by deep learning models (artificial
vision detection); v) number of harvested fruits per tree.
A paired-sample t-test revealed significant differences between the
number of manually counted fruits on the same side of the image collection and
the number of detected fruits by deep learning models (artificial vision
detection). Normally distribution was verified by Shapiro-Wilks test and mean
differences were compared to zero.
Size estimation
Laboratory and field conditions evaluated fruit size estimation. In the
first case, 106 harvested fruits of different sizes were placed in cellulose
trays and numbered. Later, the equatorial diameter was measured manually with a
digital calliper (Essex 150 mm, Stainless Hardened). Then, a 12 MP camera was
used to photograph each tray placing an object of known dimensions by each one.
In the second case, 89 apples and 98 pears were selected from various trees.
For this trial, one row of each crop was randomly selected. Then the object of
known dimensions was placed on some trees of the row. Fruits close to that
object were identified and their equatorial diameter was measured.
Image analysis was done with ImageJ software (26).
Fruit diameters were measured by drawing a straight line in the equatorial
diameter of each fruit.
Finally, Pearson correlation coefficients were calculated between the
manually measured diameter and the image-measured diameter for each situation
analyzed. In addition, differences between manually measured diameter and
image-measured diameter were calculated and divided by the mean of the manually
measured diameter. Finally, frequency distributions were plotted.
Results and discussion
Fruit detection and counting from image
analysis
Precision
values achieved were 0.86 (Figure 1) and 0.87 (Figure
2) for apples and pears, respectively, while recall was 0.83 for both
species, and F1 Score were 0.83 and 0.80 for apples and pears, respectively (Figure 3).
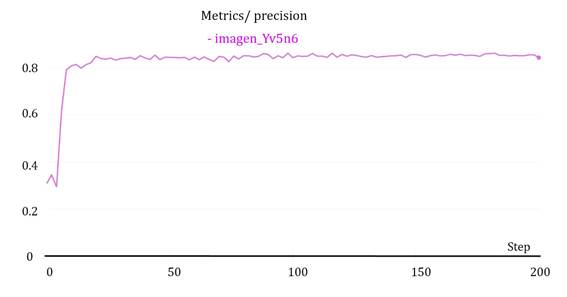
Obtained from https://wandb.ai/delbrio/yolov5s-W?workspace=user-delbrio
Figure 1. Precision graph for DL model trained for apple
detection and counting.
Figura
1. Gráfico de precisión del
modelo entrenado para detección y conteo de manzanas.
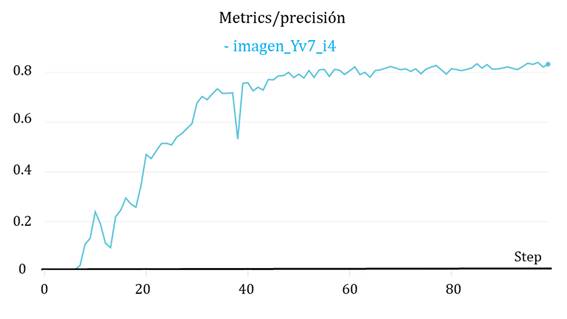
Obtained from https://wandb.ai/delbrio/yolov5s-W?workspace=user-delbrio
Figure 2. Precision graph for DL model trained for
pear detection and counting.
Figura
2. Gráfico de precisión del
modelo entrenado para detección y conteo de peras.
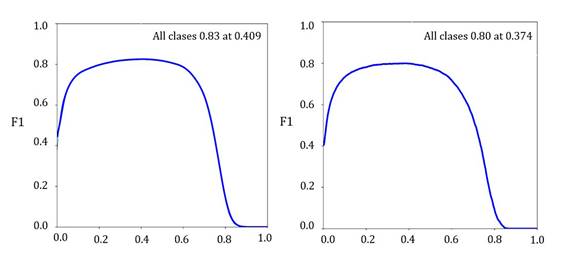
Obtained from https://wandb.ai/ delbrio/yolov5s-
W?workspace=user-delbrio
Figure 3. Left: F1 score graph for DL model trained for apple
detection and counting. Right: F1 score graph for DL model trained for pear
detection and counting.
Figura
3. Derecha: Gráfico de F1 score
del modelo entenado para detección y conteo de peras. Izquierda: Gráfico de F1
score del modelo entenado para detección y conteo de manzanas.
Obtained
values were lower than the 0.9 presented by Sa et al. (2016) for melon, raspberry, apple, orange, mango, avocado and
pepper with Faster R-CNN and VGGNet. These authors worked with their own images
for pepper and melon, and Web images for the rest of the fruits demonstrating
model robustness. The higher values obtained by these authors could be due to
the images including fruits in different maturity stages with different
colouration from the rest of the plant. They also considered a part of the
plant instead of the whole plant, with fruits occupying a greater proportion of
the image. Our trial only used whole-plant images taken under natural
conditions with smaller fruits in relation to the total image.
One
difficulty faced in this study was model ability to detect all fruits in the
clusters, also one main error source reported by Bargoti and Underwood (2017), in their apple, mangos and almond detection models.
According to Koirala et al. (2019b), values obtained by those authors could be lower than
other reference values because images were influenced by environmental
conditions, crop characteristics, and number of fruits per image (100 for
mangoes and apples, and up to 1000 for almonds). This study faced the same
issue as fruit number per image ascended to 170 and 150 in pears and apples,
respectively.
In the present trial, both daylight and night artificial light images
were used. The former could decrease model accuracy due to environmental light
conditions. Koirala et al. (2019b) evaluated many existing deep learning models and built a
hybrid MangoYOLO which combined speed and precision criteria. They mentioned
that better results were obtained from images taken at night with artificial
light, while under natural daylight conditions, the percentage of false
positives increased significantly.
Another drawback in fruit detection also evidenced in this trial,
especially in pears, is the different tree leaf densities and fruit occlusion
by leaves, branches and other fruits. These and the distinct angles to capture
images were also major difficulties mentioned by Liang et al. (2018),
who achieved precision values of 0.97 and 0.92 and recall values of 0.63 and
0.90 for mango detection with two different alternatives of Faster R-CNN
models. F1 values were between 0.79 and 0.91.
The training number of images is a main factor (6). These authors reported F1 scores between 0.79
and 0.89 depending on the amount of images used. Chen et al. (2016)
also reported lower results of F1 Score (0.76) than those obtained in this
study, probably due to the lower number of images used (71 daylight orange
images and 21 nightlight apple images).
Moreover, fruit growth stage may affect the results of this trial.
Intending to achieve yield forecast, fruit detection and counting from images
at growth stages turns crucial. Tian et
al. (2019) evaluated the YOLOv3 performance
during different apple growth stages. F1 scores were 0.83, 0.84, 0.86 and 0.82
for young, growing, ripen and total apples, respectively. Values reported for
growing apples were very close to those obtained in this trial. The highest
values obtained were for ripened apples, probably due to ripened fruit having a
larger size and a different colour compared to the rest of the plant.
Other trials using videos showed promising results probably because many
images could be taken from different angles, making fruits more visualized (15). They trained YOLOv2 and YOLOv3, with average
precision ranging from 0.88 to 0.97. Images obtained in our study were always
taken from the same angle and distance.
Correlation analysis
Correlation coefficients between labelled and harvested fruits reached
0.89 and 0.62 for apples and pears, respectively, suggesting images provided a
close approximation of apple number when forecasting. Correlation values were
lower for pears, suggesting more complex image prediction. This is given to
pear trees being larger than apple ones, with longer branches and more foliage.
In addition, at the moment of image capture, fruits were still small and green
so detection was more difficult. This agrees with Zhou et al. (2012),
who concluded that if prediction was early, many apples might remain hidden due
to size and colour.
Harvested fruits vs. manual counts of total plant reached values
up to 0.94 and 0.82 for apples and pears, respectively. These values were
higher than those obtained between harvested fruits vs. manual counts
only on the image side (0.91 and 0.70 for apples and pears, respectively). This
highlights the need to capture images on both sides of the plant for better
predictions. Dorj et al. (2017),
used three and up to four images per tree to detect and count fruits from
citrus images. That is, a higher number of images per tree could improve the
results obtained in this trial. On the contrary, Linker
(2016) concluded that more images per tree did
not throw better results.
Finally,
the correlation coefficient for manual fruit counts per tree and that detected
by a deep learning model trained from images (Photo) was
up to 0.88 and 0.73 for apples and pears, respectively. These results showed
how models accurately detected fruit in the analyzed images, constituting an
interesting alternative to traditional manual counting. Črtomir et al. (2012), in their hybrid harvest prediction model, achieved
similar results in this work for ‘Golden Delicious’ apples (between 0.73 and
0.83) while for Braeburn’ apples, results showed more variability (between 0.51
and 0.78). On the other hand, Farjon et al. (2019), used convolutional neural networks for flower detection
in ‘Golden Delicious’ apples and achieved correlations between estimated
numbers and those calculated by a group of experts of between 0.78 and 0.93.
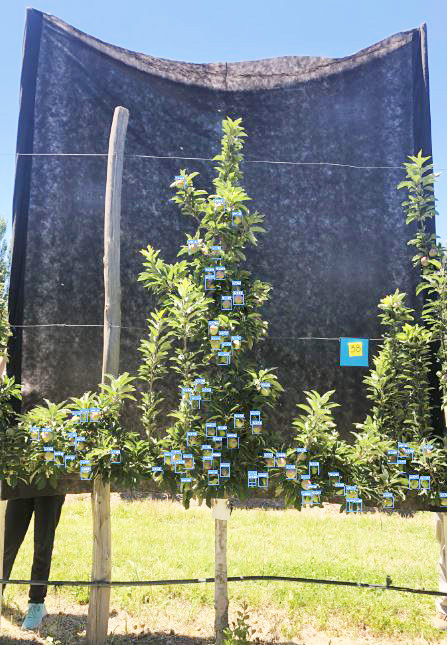
Photo. Image of an apple tree with box predictions obtained from DL model
identified with labels.
Foto.
Foto de un árbol
de manzana con las predicciones realizadas por el modelo de DL entrenado,
identificadas con etiquetas.
The results obtained in this trial could be affected by fruit growth
development at the moment of image taking. Stajnko et al. (2005),
worked with apple images taken at five different fruit growth moments and
ripening periods. They achieved correlation coefficients between 0.71 and
0.91, according to moment and cultivar. Considering that the highest values
corresponded to fruits closer to maturity, their results would be similar to
those obtained in this trial.
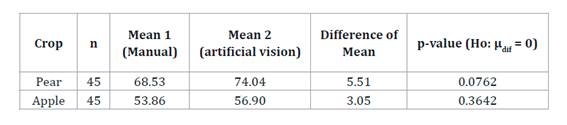
Mean differences between the number of manually counted fruits on the
same side of image collection and the number mean of detected fruits by deep
learning models (artificial vision detection) showed non-significant
differences with respect to zero (Table 1), for both pears
and apples (p-value>0.05).
Table 1. Hypothesis test on the equality to zero of mean differences between the
number of fruits detected by Deep Learning models (artificial vision) and
number of fruits counted manually on the same side of pear and apple trees.
Tabla 1. Prueba de hipótesis sobre la igualdad a cero de la media de las diferencias entre la cantidad de frutos detectados por los modelos de Depp Learning (vision artificial) y cantidad de frutos contados manualmente sobre el mismo lado del árbol para el cultivo de pera y manzana.
Size estimation
Correlation
coefficients obtained between manually measured diameter and image diameter
were 0.89 for laboratory fruits, 0.73 for field apples and 0.80 for field
pears. Laboratory fruits showed higher correlation than field ones, probably
given by fruit position in the tree being much more variable than in the
laboratory. In addition, fruits hanging far from the object of known dimensions
used as scale could increase error. To improve this methodology in the future,
measuring should only consider fruits close to the scaling object or the
placement of more scaling objects per image. Stajnko et al. (2005) also worked on estimating fruit diameters at different
growing stages from ‘Golden Delicious’ and ‘Gala’ apple images obtaining highly
variable coefficients with values ranging from 0.19 to 0.79 for ‘Golden
Delicious’ and 0.34 to 0.88 for ‘Gala’. Different values correspond to
different fruit growth stages and seasons. Low correlation coefficients could
be due to the algorithm based on the longest segment fruit measurement. Some
values found by these authors resulted similar to those in this trial. Stajnko et al. (2009) also concluded an
overestimation of the diameters in ‘Jonagold’ and ‘Golden Delicious’ apples
when images were taken in young fruits, while underestimation occurred in
ripened fruits. These results differed from those we found for pears since
ripen ones were overestimated. On the other hand, apple results were variable,
showing both diameters under and overestimation (Figure 4).
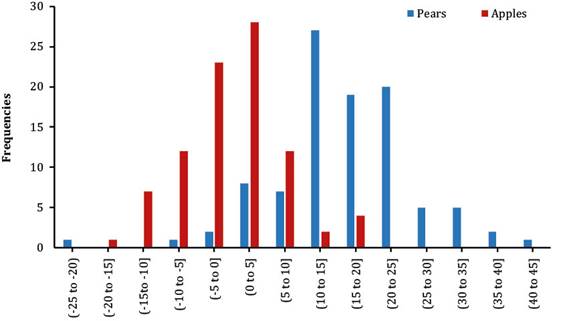
Differences
between manual diameter measurements and image diameter measurements (% with
respect to the mean of manual diameter measurements).
Diferencias entre los
diámetros medidos manualmente y los medidos a partir de imágenes (expresados en
% respecto de la media de las mediciones manuales).
Figure 4. Frequency distribution for differences between image
diameter measurements and manual diameter measurements divided by mean manually
measured diameter in apples and pears.
Figura
4. Gráfico de distribución de
frecuencias para las diferencias entre los diámetros medidos por imágenes y los
medidos manualmente divididos por la media de los diámetros medidos manualmente
en peras y manzanas.
Conclusion
Fruit number on both apple and pear trees could be estimated from images
with promising results. They could be improved by increasing the amount of
input data to the deep learning models. This includes more image
taking in many different conditions (angles, distances to the focus, fruit
growth stages, tree size, spacing, age and management conditions).
The possibility of estimating fruit number from images could reduce time
costs, allowing growers to increase the number of sampled trees for yield
forecasts.
Fruit size estimation from images was not accurate in this study,
varying according to fruit proximity to the scaling object. Fruit size
estimation also depends on fruit position on the tree and consequent
visibility.
Acknowledgements
This work was supported by the Instituto Nacional de Tecnología
Agropecuaria (INTA), Consejo Nacional de Investigaciones Científicas y Técnicas
(CONICET) and Universidad Nacional del Comahue (PI E115).
1. Aggelopoulou,
A. D.; Bochtis, D.; Fountas, S.; Swain, K. C.; Gemtos, T. A.; Nanos, G. D.
2011. Yield prediction in apple orchards based on image processing. Precision Agriculture. 12: 448- 456.
doi.org/10.1007/s11119-010-9187-0
2. Aruani, M.
C.; Reeb, P. D.; Barnes, N. E. 2014. Influence of soil properties on yield and
fruit maturity at harvest of ‘Williams’ pear. Chilean journal
of agricultural research. 74(4): 460-467. doi.
org/10.4067/S0718-58392014000400013
3. Avanza, M.
M.; Bramardi, S. J.; Mazza, S. M. 2010. Optimal sample size for evaluate the
growth pattern of ‘Valencia late’ orange fruit. Revista
Brasileira de Fruticultura. Jaboticabal. 32(4): 1154- 1163.
4. Bargoti, S.;
Underwood, J. 2017. Deep fruit detection in orchards. arXiv:1610.03677.v2[cs.RO]
5. Best,
S.; Salazar, F.; Bastías, R.; Leon, L. 2008. Crop load
estimation model to optimize yield - quality ratio in apple orchards, Malus
Domestica Borkh, Var. Royal
Gala. Journal of Information Technology in Agriculture. 3: 11-18.
6. Bresilla, K.;
Demetrio Perulli, G.; Boini, A.; Morandi, B.; Corelli Grappadelli, L.;
Manfrini, L. 2019. Single-Shot convolution neural networks
for real-time fruit detection within the tree. Front. Plant.
Sci. 10: article 611. https://doi.org/10.3389/fpls.2019.00611
7. Bulanon, D.
M.; Kataoka, T.; Ota, Y.; Hiroma, T. 2002. A segmentation algorithm for the
automatic recognition of fuji apples at harvest.
Biosystem Engineering. 83: 405-412. https:// doi.
org/10.1006/bioe.2002.0132
8. Chen, S. W.;
Shivakumar, S. S.; Dcunha, S.; Das, J.; Okon, E.; Qu, Taylor, C. J.; Kumar, V.
2016. Counting apples and oranges with deep learning: a data driven approach. IEEE robotics and automation letters. 2(2): 781-788.
https://doi.org/10.1109/LRA.2017.2651944
9. Cohen, O.;
Linker, R.; Naor, A. 2011. Estimation of the number of apples in color images
recorded in orchards. International Federation for Information Processing, Part
I, AICT. 344: 630-642.
10. Črtomir, R.;
Urška, C.; Stanislav, T.; Denis, S.; Karmen, P.; Pavlovič, M. 2012. Application of neural networks and image visualization for early
forecast of apple yield. Erwerbs-Obstbau. 54:
69-76. https://doi.org/10.1007/s10341-012-0162-y
11. Dorj, U.;
Lee, M.; Yun, S. 2017. An yield estimation in citrus
orchards via fruit detection and counting using image processing. Computers and Electronics in Agriculture. 140: 103-112.
https:// doi.org/10.1016/j.compag.2017.05.019
12. Farjon, G.;
Krikeb, O.; Bar, A.; Victor, H. 2019. Detection and counting
of flowers on apple trees for better chemical thinning decisions. Precision
Agriculture . 21: 503-521. https://doi.
org/10.1007/s11119-019-09679-1
13. Gongal, A.;
Amatya, S.; Karkee, M.; Zhang, Q.; Lewis, K. 2015. Sensors and systems for
fruit detection and localization: A review. Computers and
Electronics in Agriculture. 116: 8-19. https://
doi.org/10.1016/j.compag.2015.05.021
14. Hočevar, M.;
Širok, B.; Godeša, T.; Stopar, M. 2014. Flowering estimation
in apple orchards by image analysis. Precision
Agriculture . 15: 466-478.
https://doi.org/10.1007/s11119-013-9341-6
15. Itakura, K.;
Narita, Y.; Noaki, S.; Hosoi, F. 2021. Automatic pear and apple detection by
videos using deep learning and a Kalman filter. Osa Continuum. 14(5):
1688-1695. https://doi. org/10.1364/OSAC.424583
16. Karkee, M.;
Zhang, Q. 2012. Mechanization and automation technologies in specialty crop
production. Resource Magazine. 19(5): 16-17.
https://doi.org/10.13031/2013.42314
17.
Koirala, A.; Walsh, K. B.; Wang, Z.; McCarthy, C. 2019a. Deep
Learning - Method overview and review of use for fruit detection and yield
estimation. Computers and Electronics in Agriculture.
162: 219-234. https://doi.org/10.1016/j.compag.2019.04.017
18.
Koirala, A.; Walsh, K. B.; Wang, Z.; McCarthy, C. 2019b. Deep
learning for real-time fruit detection and orchard fruit load estimation:
benchmarking of ‘MangoYOLO. Precision Agriculture . 20: 1107-1135.
https://doi.org/10.1007/s11119-019-09642-0
19. Kurtulmus,
F.; Suk, W.; Vardar, A. 2011. Green citrus detection using ‘eigenfruit’, color
and circular Gabor texture features under natural outdoor conditions. Computers and Electronics in Agriculture. 78(2): 140-149.
https://doi.org/10.1016/j.compag.2011.07.001
20. Liang, Q.;
Zhu, W.; Long, J.; Wang, Y.; Sun, W.; Wu, W. 2018. A
real-time detection framework for on-tree mango based on SDD Network. Springer Nature Switzerland. 10985: 423-436.
https://doi.org/10.1007/978-3-319-97589-4_36
21. Linker, R.
2016. A procedure for estimating the number of green mature apples in
night-time orchard images using light distribution and its application to yield
estimation. Precision Agriculture . 18: 59-75.
https://doi.org/10.1007/s11119-016-9467-4
22. Liu, W.;
Anguelov, D.; Erhan, D.; Szegedy, C.; Reed, S.; Fu, C. Y.; Berg, A. C. 2016.
SSD: Single shot multi box detector. Computer Vision ECCV Lecture Notes in
Computer Science.. 9905: 21- 37.
https://doi.org/10.1007/978-3-319-46448-0_2
23. Mao, W.;
Jia, B.; Zhang, X.; Hub, X. 2009. Detection and position
method of apple tree image. Computer and Computing
Technologies in Agriculture II. IFIP Advances in
Information and Communication Technology. 2: 1039-1048.
https://doi.org/10.1007/978-1-4419-0211-5_29
24. Parrish, E.
A.; Goksel, A. K. 1977. Pictorial pattern recognition applied to fruit
harvesting. ASAE. 20(5): 822-827.
https://doi.org/10.13031/2013.35657
25. Qureshi, W.
S.; Payne, A.; Walsh, K. B.; Linker, R.; Cohen, O.; Dailey, M. N. 2016. Machine vision for counting fruit on mango tree canopies. Precision
Agriculture . 18: 224-244. https://doi.
org/10.1007/s11119-016-9458-5
26. Rasband, W.
S. 1997-2018. ImageJ.. U. S. National Institutes of
Health Bethesda. Maryland. USA. https://imagej.nih.gov/ij/
27. Redmon, J.;
Farhadi, A. 2018. YOLO v3: An incremental improvement. ArXiv:1804.02767.
https:// doi.org/10.48550/arXiv.1804.02767
28. Ren, S.; He,
K.; Girshick, R.; Sun, J. 2015. Faster R-CNN: Towards Real-Time Object
Detection with Region Proposal Networks. Advances in Neural Information
Processing Systems, arXiv:1506.01497.
https://doi.org/10.48550/arXiv.1506.01497
29. Sa, I.; Ge,
Z.; Dayoub, F.; Upcroft, B.; Perez, T.; Mccool, C. 2016. DeepFruits: A Fruit
Detection System Using Deep Neural Networks. Sensors.
16(8): 1-23. https://doi.org/10.3390/s16081222
30.
Stajnko, D.; Èmelik, Z. 2005. Modelling of apple fruit growth
by application of image analysis. Agriculturae
Conspectus Scientificus. 70(2): 59-64.
31. Stajnko, D.;
Rakun, J.; Blanke, M. 2009. Modelling apple fruit yield using image analysis
for fruit colour, shape and texture. European Journal of
Horticultural Science. 74(6): 260-267.
32. Tian, Y.;
Yang, G.; Wang, Z.; Wang, H.; Li, E.; Liang, Z. 2019. Apple detection during
different growth stages in orchards using the improved YOLO-V3 model. Computers and electronic in agriculture. 157: 417-426.
https://doi.org/10.1016/j.compag.2019.01.012
33. Wachs, J.
P.; Stern, H. I.; Burks, T.; Alchanatis, V. 2010. Low and
high-level visual feature-based apple detection from multi-modal images. Precision
Agriculture . 11: 717-735. https://doi.
org/10.1007/s11119-010-9198-x
34. Wang, D.;
He, D. 2021. Channel Pruned YOLOv5s based-Deep learning approach for rapid and
accurate apple fruitlet detection before fruit thinning. Biosystem
engineering. 210: 271- 281.
https://doi.org/1016/j.biosystemseng.2021.08.015
35. Zhou, R.;
Damerow, L.; Sun, Y.; Blanke, M. M. 2012. Using colour features of cv. ‘Gala’
apple fruits in an orchard in image processing to predict yield. Precision
Agriculture . 13: 568-580.
https://doi.org/10.1007/s11119-012-9269-2