Revista de la Facultad de Ciencias
Agrarias. Universidad Nacional de Cuyo. Tomo 57(2). ISSN (en línea) 1853-8665.
Año 2025.
Original article
Variations
of Atmospheric Emissions in the Biomass Burning of Tree Species as an
Environmental Indicator
Variaciones
de emisiones atmosféricas en la quema de biomasa de especies arbóreas como
indicador ambiental
Jorge Alonso Alcalá
Jáuregui1*,
María Fernanda
Ramírez Cubos1,
Ángel Natanael
Rojas Velázquez1,
Idrissa Diedhiou2,
María Flavia
Filippini3,
Daniela Cónsoli3,
Eduardo Martínez
Carretero4,
Juan Carlos
Rodríguez Ortiz1
Oscar Iván Guillén
Castillo1
Marcela Ontivero4
1Universidad Autónoma de San Luis Potosí. Facultad de Agronomía y
Veterinaria. Km. 14.5 Carretera San Luis-Matehuala Apdo. Postal 32 CP 78321
Soledad de Graciano Sánchez. San Luis Potosí. México.
2Universidad EARTH. Las Mercedes de Guácimo. Guácimo 70602. Costa
Rica.
3Universidad Nacional de Cuyo. Facultad de Ciencias Agrarias.
Catedra Química Agrícola. Almirante Brown 500. M5528AHB. Chacras de Coria.
Mendoza. Argentina.
4IADIZA (CONICET). Geobotánica y Fitogeografía. Mendoza.
Argentina.
*jorge.alcala@uaslp.mx
Abstract
Biomass burning
(BB) serves as both an energy source and an environmental indicator. This study
examined how CO₂ and fine particle emissions vary during the combustion of
biomass from three tree species to determine their contribution to
environmental pollution. Leave and stem samples were taken from A.
farnesiana (huizache) tree, S. molle (pirul), and P. laevigata (mesquite).
The dry biomass was thermally processed in a muffle furnace at temperatures
ranging from 50°C to 450°C. Emissions of CO₂, particles smaller than 2.5
microns (PM2.5),
particles smaller than 10 microns (PM10),
and total volatile organic compounds (TVOC) were measured. The highest emission
levels occurred during the pyrolysis process between 250°C and 450°C in both
leaves and stems. Among the leaves, the highest emissions of PM2.5 and PM10 were found in huizache,
while the highest values were found in mesquite stems. In terms of leaves,
mesquite had the highest CO₂ emissions, followed by huizache and pirul.
Regarding the stems, pirul had the highest atmospheric emissions of CO₂,
followed by huizache and mesquite. In all cases, emission levels exceeded the
limits established by Mexican and international environmental regulations,
indicating a significant risk to the environment and public health.
Keywords: Carbon dioxide,
fine particles, incineration temperature, permissible limits
Resumen
La quema de biomasa
(BB) sirve tanto como fuente de energía como indicador medioambiental. Este
estudio examinó las variaciones de las emisiones de CO₂ y partículas finas
durante la combustión de biomasa de tres especies de árboles para determinar su
contribución a la contaminación medioambiental. Se tomaron muestras de hojas y
tallos de A. farnesiana (huizache), S. molle (pirul) y P.
laevigata (mezquite). La biomasa seca se procesó térmicamente en un horno
de mufla a temperaturas que oscilaron entre 50°C y 450°C. Se midieron las
emisiones de CO₂, partículas menores de 2,5 micras (PM2.5),
partículas menores de 10 micras (PM10)
y compuestos orgánicos volátiles totales (TVOC). Los niveles más altos de
emisión se produjeron durante el proceso de pirólisis entre 250°C y 450°C,
tanto en las hojas como en los tallos. Entre las hojas, las emisiones más altas
de PM2.5 y PM10 se encontraron en el
huizache, mientras que los valores más altos se encontraron en los tallos del
mezquite. En cuanto a las hojas, el mezquite tuvo las emisiones más altas de
CO₂, seguido del huizache y el pirul. En cuanto a los tallos, el pirul tuvo las
emisiones atmosféricas más altas de CO₂, seguido del huizache y el mezquite. En
todos los casos, los niveles de emisión superaron los límites establecidos por
las regulaciones ambientales mexicanas e internacionales, lo que indica un
riesgo significativo para el medio ambiente y la salud pública.
Palabras clave: Dióxido de carbono,
partículas finas, temperatura de incineración, límites permisibles
Originales: Recepción: 18/04/2025 - Aceptación: 17/11/2025
Introduction
Biomass burning
(BB) is the combustion of plant materials, which are widely used for energy
production. It is increasingly recognized as an environmental indicator,
particularly of air quality. Energy sources can be broadly classified as solid
or non-solid fuels. The former includes coal, biomass, unprocessed wood,
charcoal, manure, and crop residues. The latter includes kerosene, liquefied
petroleum gas, natural gas, electricity, and others (8,
45, 51). Furthermore, BB is a significant contributor to air pollution
with global, regional, and local implications for air quality, public health,
and climate (21, 45). It emits trace
gases and particulate matter into the atmosphere (19). It emits trace
gases and particulate matter into the atmosphere. Therefore, the quantification
of emissions and their impact assessment have been studied in various regions
of the world (21, 45). In urban areas,
around 50% of households use solid fuels, primarily coal and biomass, for
energy, exposing themselves to the harmful effects of combustion residues. This
affects nearly 50% of the global population, i.e., over 3 billion people
(51). Biomass
originates from trees, agricultural crops, and other living plant materials.
Furthermore, burning is a common, cost-effective, and time-efficient method of
disposing of biomass residues from agricultural processes and other sectors.
This practice has become increasingly widespread during the pre- and
post-harvest seasons (41). From a health
perspective, CO₂ is produced when biomass burns efficiently. Oxygen from the
atmosphere combines with carbon from plants to produce CO₂ at a technological
level. In the field of biomass-to-energy conversion, several technologies are
in use, including combustion, anaerobic digestion (biogas plants), and
thermochemical pretreatment. Promising emerging technologies include thermal
gasification, torrefaction, and pyrolysis (33). The main
technologies used in experimentation to exploit organic waste or biomass focus
on chemical-biological processes, bioenergy, environmental treatment,
pyrolysis, gasification, combustion, synthesis, hydrolysis, fermentation, and
product separation (1). Other sources
indicate that biomass conversion technologies fall into three categories:
combustion, thermal gasification, and pretreatment. In pyrolysis, a
thermochemical route, biomass is heated between 400°C and 600°C in the absence
of oxygen. The process produces three products: solid charcoal, liquid
pyrolysis oil (bio-oil), and a gaseous product (33). Pyrolysis is
characterized by high heating rates, with temperature control close to 500°C (1,
12, 14). In contrast, torrefaction is considered a mild form of
pyrolysis (200°C<T<300°C) and is carried out in an inert atmosphere or
with steam. This brings the biomass into contact with a heating medium that
gradually raises its temperature by less than 50°C per minute until it reaches
200-300°C (13). In practice,
these burning processes release various pollutants, mainly gases and
particulate matter, into the atmosphere. These pollutants include formaldehyde
(HCHO), methane (CH₄), sulfur oxides (SOx), nitrogen oxides (NOx), carbon
monoxide (CO), carbon dioxide (CO₂), and different sizes of respirable
particulate matter (PM3.5),
such as PM₁, PM2.5,
and PM₁₀ (9, 43, 51, 53, 55). The process is
cyclical because CO₂ and water are produced, which are then used in the
photosynthetic process to produce carbohydrates that form the basic components
of biomass (9). In contrast,
particulate matter emissions have been linked to severe damage, including
alterations in photosynthesis, changes in plant growth, and alterations in
plant reproduction (36). In line with
global monitoring efforts, the United Nations Agenda 2030 for Sustainable
Cities and Communities evaluates air quality by considering fine suspended
particles PM2.5 and PM10,
as indicators (38). PM2.5 is the environmental
factor posing the greatest health risk, contributing to over 4.1 million deaths
worldwide in 2016 (31). For instance, a study of 708 European urban
areas found that 22% of PM emissions came from urban cores and commuting areas.
The average contributions of industrial activity, agriculture, and road
transport were 18%, 17%, and 14%, respectively. Furthermore, 27% of the
emissions came from a group of cities in northern Italy, while eastern Europe
contributed more than 50% (58). The World Health
Organization (WHO) recommends annual mean exposures of 10 μg/m³ of PM2.5
and 20 μg/m³ of PM10 to minimize health
impacts (34, 40, 56). In Mexico,
NOM-021-SSA1-2021 establishes permissible values for suspended particulate
matter PM10 and PM2.5 in ambient air, including
evaluation criteria (25). Furthermore,
studies of air pollution by BB combine a series of variables and perspectives.
These variables and perspectives consider the spatial and temporal scales, as
well as the associated implications and impacts on human health, regional air
quality, ecosystem health, climate change, and intercontinental pollution (52). Along these lines,
studies of biomass derived from organic sources, such as agricultural and
forest residues and dedicated energy crops, aim to identify sustainable energy
options while evaluating their environmental impact, such as greenhouse gas
emissions (8, 26). The species Prosopis
laevigata (mesquite), Schinus molle (pirul), and Acacia
farnesiana (huizache) have been associated with studies on environmental
pollution in the state of San Luis Potosi (3,
4, 5, 6, 23). In some regions of Mexico, species such as mesquite (Prosopis
sp.) are used as a source of charcoal due to their calorific potential (23). This indicates
the need to explore alternatives to assess the impact of biochar (BB) on tree
species. In some cases, dry leaves, bark, and pruning residues are used as fuel
(45). Thus, this study
aimed to evaluate variations in atmospheric emissions from burning biomass
(stems and leaves) of these tree species to expand pollution research in San
Luis Potosi, Mexico. The hypothesis is that emissions differ among species and
between biomass types (leaves vs. stems), influencing compliance with
environmental regulations in a laboratory-scale pilot test under a controlled
pyrolysis/combustion process.
Materials
and Methods
The study was
conducted at Ejido Palma de la Cruz, Soledad de Graciano Sanchez, San Luis
Potosi, Mexico (24°14’58’’N and 100°51’53’’W; 1,836 m a. s. l.) (figure 1).

Figure
1. Study area and sampling points for biomass
collection.
Figura
1. Área de estudio y puntos de
muestreo de la colecta de biomasa.
Sample
Collection
Nine sampling points were randomly selected within stands
dominated by Prosopis laevigata, Acacia farnesiana, and Schinus
molle, focusing on individuals taller than two meters. For each species,
leaf and stem material was collected 1.6-1.8 meters above the ground after
flowering. The samples were transported to the laboratory. The leaves and stems
were separated, rinsed to remove dust and debris, and air-dried at room
temperature. Fresh and dry biomass weights (g) were recorded to estimate total
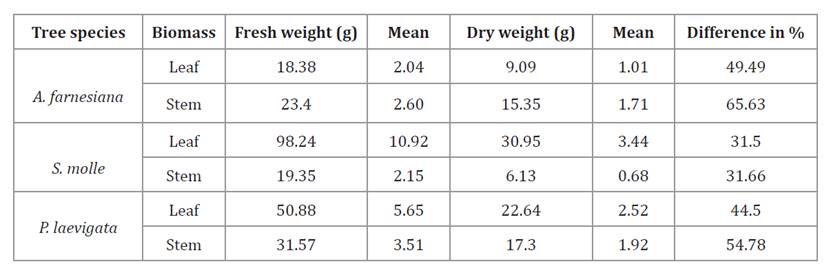
fresh weight per species and per plant organ (leaves and stems) (table 1). In total, nine
composite samples per species were obtained (n=9 per organ per species). To
determine the total dry weight per species, biomass was placed in a drying oven
at 60°C for 48 hours in a RIOSSA H-48-48 stove.
Table 1. Estimated
total fresh and dry biomass weight of the tree species (g).
Tabla
1. Estimación del peso fresco y seco
total de la biomasa de las especies arbóreas (g).
Measurement
of Incineration Gases and Atmospheric Particles
Ambient
concentrations of carbon dioxide (CO₂), particulate matter (particles smaller
than 2.5 and 10 microns), PM2.5,
PM₁₀, total volatile organic compounds, relative humidity, and temperature were
recorded before measurement. The dry weight generated by each species (leaf and
stem) was divided into six crucibles, each containing an average sample of 1.5
g, for the dry weight samples of leaves of each species. For the stems, four
crucibles were used with an average dry weight range of 1.5 g. This was done
because the total biomass of the leaves and stems of each species lost between
31.5% and 54.78% of their weight. To homogenize the distribution of biomass, an
average of 1.5 g per sample was used (table 1). This could be a
limitation to consider when increasing the amount of experimental dry biomass
in future studies. According to certain criteria of some authors, the biomass
was subjected to the pyrolysis process at temperatures ranging from 50°C to 450°C
(1,
12, 14).
The prepared
samples were incinerated in an electric muffle furnace (LabTech® Daiha Lantech
Co. LTD) at 50, 100, 150, 200, 250, 300, 350, 400, and 450°C. Measurements of
CO₂ (ppm), PM2.5 (μ/m3),
PM10 (μ/m3),
TVOC (total volatile organic compounds, g/m3),
% relative humidity, and temperature (°C) were performed using HT-9600 (Dust
Particle Counter®) and BLATN Smart (Portable Air Quality Monitor®) equipment.
These devices were stabilized for an average of two hours for the environmental
measurement. Some methodological criteria regarding sample handling and
particle measurement were considered in previous studies (7). Results were
interpreted using guideline values from the United States Environmental
Protection Agency and the World Health Organization (34,
35, 40), as well as those referred to in the manuals of the measuring
equipment. Additionally, the Mexican Official Standard NOM-025-SSA1-2021 (25) was considered by
comparing the average emission values with the 24-h permissible limits
established by the standard of the real emission (maximum and minimum values).
Statistical
Analysis
The variables
included total and specific biomass (leaves and stems) by species, ambient
temperature, percent relative humidity, incineration temperatures, gas,
atmospheric particulate emissions, dry weight, and residual ash. The data were
analyzed using Minitab® software, version 16. Analysis of variance was used
with Tukey’s test at a significance level of p≤0.05. Correlation analysis
(Pearson correlation coefficient) and principal component analysis (PCA) were
also performed on all variables studied in this experiment.
Results
and Discussion
A significant Pearson correlation (p≤0.05) was detected between
gaseous emissions (CO₂, TVOC) and fine particles (PM2.5,
PM10) and
ambient conditions (relative humidity and air temperature). Additionally, the
Tukey test distinguished between total biomass emissions and emissions
generated by the pyrolysis of leaves and stems from the three species,
revealing pronounced differences at 200-400°C. On the other hand, principal
component analysis revealed the set of data (gases and particles) that explains
variation in incineration temperatures and species with higher or lower biomass
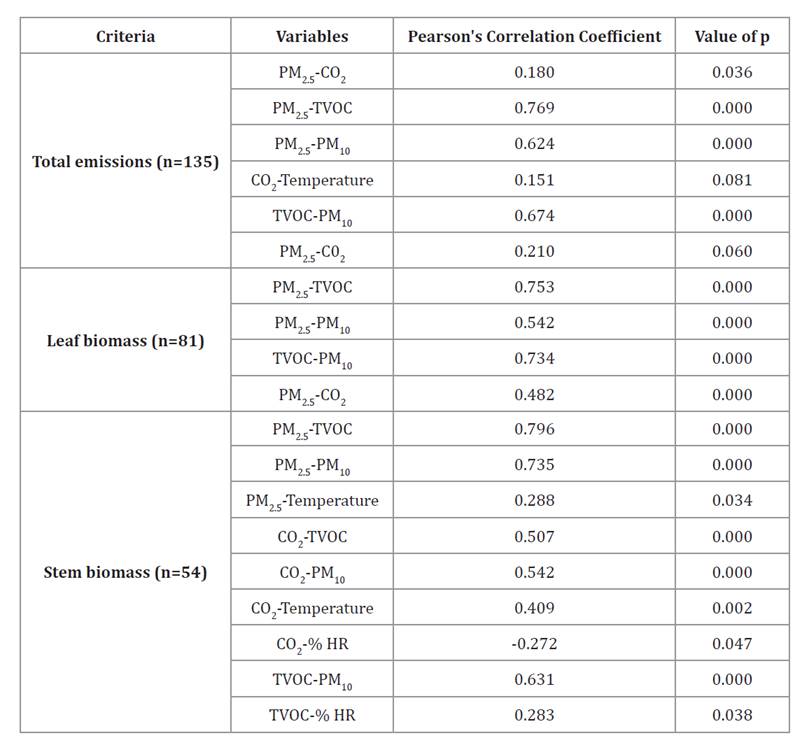
emissions. Regarding the Pearson correlation (table 2), the strongest
significant associations among the total emission variables were between PM2.5
and TVOC (r²=0.76) and between PM2.5 and PM10 (r²=0.62). Higher values
were observed for leaf biomass with PM2.5-TVOC
(r²=0.75) and TVOC-PM₁₀ (r²=0.73). Higher correlations were also observed for
leaf biomass with PM2.5-TVOC
and TVOC-PM10.
Ten significant correlations were identified in stem biomass; the strongest was
between PM2.5 and TVOC (r²=0.79).
Table 2. Results
of Pearson’s Correlation Coefficient on atmospheric variables in biomass
incineration (pyrolysis process) of three tree species (p≤0.05).
Tabla
2. Resultados del coeficiente de
correlación de Pearson en las variables atmosféricas de la incineración
(proceso de pirólisis) de biomasa de tres especies arbóreas (p≤0,05).
Total
Biomass Burning Emissions
An analysis of 181
samples revealed that incineration temperature, biomass origin (tree species),
and biomass type (leaf or stem) significantly affected total CO₂, PM2.5, PM₁₀, and TVOC
emissions (Tukey, p≤0.05). Considering the effect of incineration temperature
(50°C-450°C), physically bound moisture is removed at 20-120°C. Above 160°C,
chemically bound water is released through thermal condensation.
Between 120 and
150°C, the -H- and -C- bonds break, producing short-chain polymers that
condense within the pores. As the temperature increases to between 150 and
270°C, carbon dioxide (CO₂), carboxylic acids, phenol, furfural, methanol, and
other organic molecules are generated. This is primarily due to hemicellulose
depolymerization and the release of carbonyl and carboxyl groups from
cellulose. Lignin also overgoes reactions of aromatic rings in lignin (5,
13, 15, 16, 22, 23, 39). As the process progresses, the biomass darkens and begins to
resemble coal in terms of its properties. The most intense heat consumption and
mass loss occur in the early stages (13). According to
another technical source, volatile gases are released when the temperature of
dry biomass reaches 200°C-350°C during pyrolysis. These include carbon monoxide
(CO), carbon dioxide (CO₂), methane (CH₄), and high-molecular-weight compounds
(tar), which condense into a liquid when cooled. These gases mix with oxygen in
the air and burn to produce a yellow flame. This self-sustaining process
involves heat from gas combustion, drying fresh fuel, and releasing additional
volatiles. Once all the volatiles have burned, the remaining solid is coal (44). Other
contributing factors include species-specific chemical compositions and
structural differences. For instance, a study of Schinus molle L.
essential oil identified nineteen compounds, with the major ones being
bicyclogermacrene, beta-caryophyllene, and spathulenol (37). As for P.
leavigata, different compounds have been found in its various organs,
including the fruit, leaves, and flowers. These compounds include phenolic
compounds and alkaloids, as well as the concentrations of 4-hydroxybenzoic
acid, p-coumaric acid, gallic acid, chlorogenic acid, cinnamic acid, and
p-coumaric acid (29). Studies on the
composition of A. farnesiana demonstrate that it essentially contains
terpenes, phenolic acids, flavonoids, tannins, alkaloids, fatty acids from seed
oils, polysaccharides, non-protein amino acids, and other phytochemicals (20).
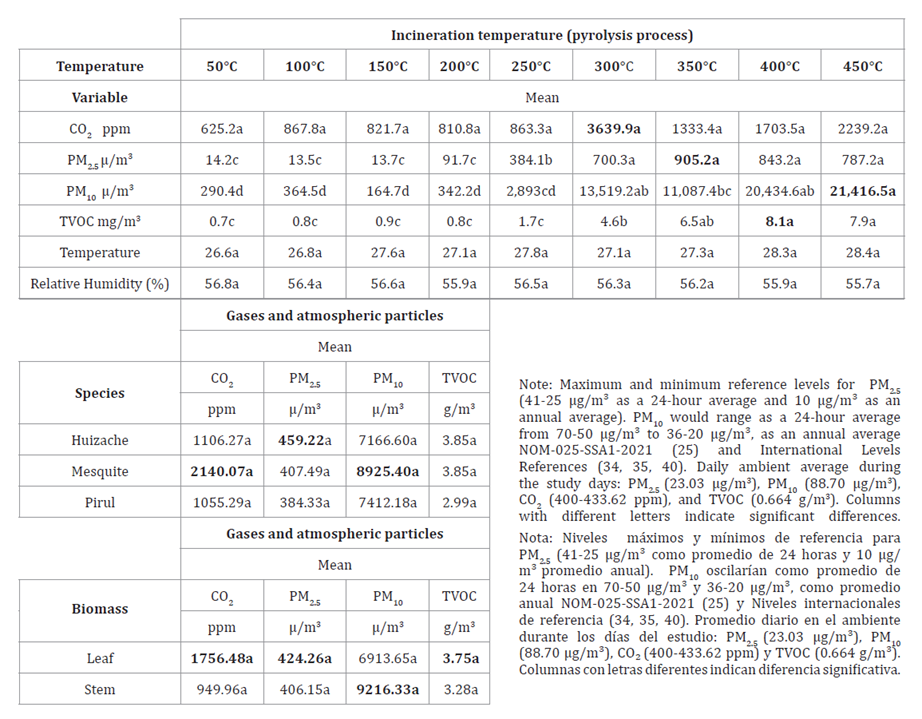
CO₂ emissions from the total biomass of the three species were
prioritized among the results because of their relevance as a greenhouse gas.
The CO₂ emissions data revealed that the highest mean value was reached at
300°C, with a difference of 3,014.7 ppm. The lowest emissions occurred at 50°C
(table
3).
Due to its biogenic origin, the CO₂ released during biomass combustion is
generally equivalent to the CO₂ absorbed during growth of trees, crops, and
other plant-based residues (8). CO₂ is a
greenhouse gas present in the global atmosphere at approximately 412 ppm, and
it is projected to increase (17). Using this
reference level, the emission measured in this study at 300°C (3,639.9 ppm)
exceeded the atmospheric reference by 8.83 times and the maximum average
reported for the study area by 8.39 times. Additionally, outdoor air typically
contains 300-400 ppm of CO₂ and can reach up to 550 ppm in urban areas (49).
Table 3. Ratio
of total gas emissions and total atmospheric particulate matter from biomass
burning of three tree species (Tukey, p≤0.05, n=135).
Tabla
3. Relación de emisiones totales de
gases y partículas atmosféricas totales de la quema de biomasa de tres especies
arbóreas (Tukey, p≤0,05, n=135).
Other studies
indicate that CO and CO₂ are primarily released at temperatures below 450°C and
exhibit similar patterns. Increasing the heating rate positively influences the
yield of combustible gases (46). At 450°C, PM10
emissions were higher, with an average of 21,416.5 μ/m³, compared
to an average of 21,251.8 μ/m³ from the incinerated biomass at 150°C. Mexico’s
NOM-025-SSA1-2021 establishes permissible PM10 concentration limits
maximum at 70 μg/m³, minimum at 50 μg/m³ (24-hour average) and 36 μg/m³ (annual
average) (25). Using the 24-hour criterion (70
μg/m³), the highest emission average over 24 hours was 892.25 μ/m³, and the
lowest was 6.86 μ/m³. At 450°C, PM₁₀ exceeded the 24-hour permissible limit by
a factor of 12.74, highlighting a significant environmental hazard. The value
of 892.25 μ/m³ was 10.05 times higher than the average recorded in the study
area during the experimental phase. Using the 24-hour criterion (50 μg/m³), the
highest emission average over 24 hour at 450°C, PM₁₀ exceeded the permissible
limit by a factor of 17.84 times. Elevated PM₁₀ levels have been linked to
adverse effects on plant physiological functions, including photosynthesis and
growth inhibition (36).
A study that burned
olive tree pruning waste and performed a chemical characterization estimated
average PM10 concentrations at 2,165
μg/m³, about fifty times higher than the PM10 concentrations estimated
at reference sites under normal conditions. These emissions were associated
with carbonaceous fractions, such as potassium (K), lead (Pb), and polycyclic
aromatic hydrocarbons (PAHs), as well as benzo(a)anthracene, benzo(a)pyrene,
and benzo(K)fluoranthene, for the biomass combustion source (10).
The highest PM2.5
emission, 905.2 μ/m³, was observed at 350°C, which is 891.7 μ/m³
higher than the average emission at 100°C. In accordance with NOM-025-SSA1-2021
(25), the maximum and
minimum permissible limits for PM2.5 are 41 μg/m³ and 25 μg/m³
(24-hour average) and 10 μg/m³ (annual average). In this context, the highest
recorded emission was 37.71 μg/m³ over a 24-hour period, not exceeding the
permissible limit of 41 μg/m³. This value was 39.30 times higher than those
recorded during the experimental days in the study area atmosphere. However,
with the minimum reference level (25μg/m³), this limit is 1.50 times higher. PM2.5
can originate from various sources and therefore exhibits
differences in chemical composition and physical characteristics. Common components
of PM2.5 include sulfates, black
carbon, nitrates, and ammonium. Sources of anthropogenic PM2.5 are mainly related to
combustion engines, industrial processes, power generation, burning coal and
wood, agricultural activities, and construction. Natural sources include dust
storms, forest fires, and sandstorms (35). On the other
hand, PM2.5 has been linked to toxic
levels of nickel (Ni), chromium (Cr), lead (Pb), arsenic (As), and black carbon
(BC). Its main sources of emission include coal combustion, industrial
activity, resuspended dust, and biomass burning. This indicates the urgent need
for control measures (32, 35). PM2.5 commonly contains
sulfates, black carbon, nitrates, and ammonium (35). According to the
U.S. Air Quality Index, PM2.5 concentrations over 250.5
μg/m³ pose a high risk to public health and the environment (34). In agricultural
areas, high levels of PM10 and PM2.5 have been reported,
reaching 800 μg/m³ and 485 μg/m³, respectively (57). Populations in
low- and middle-income countries are exposed to environmental PM2.5 levels between 1.3 and 4
times higher (31). While the
interspecific ratio of mean total emissions was not statistically significant, P.
laevigata emitted 1,084.78 ppm of CO₂, surpassing S. molle. Among the evaluated species, A. farnesiana
exhibited the highest PM2.5 emissions, surpassing S.
molle by 74.89 μg/m³. P. laevigata showed the highest levels of
PM₁₀, surpassing A. farnesiana by 1,758.8 μg/m³ (table 3). This highlights
notable interspecific variation in particulate emissions. The chemical analysis
of P. laevigata wood revealed that it contains 7.36% hemicellulose,
48.28% cellulose, 30.57% lignin, and 13.53% extractives (42).
Other studies on
the energy characterization of charcoal from species such as Prosopis have
found elements like magnesium (Mg), calcium (Ca), copper (Cu), zinc (Zn), and
iron (Fe) in charcoal and ash. These studies reported a higher calorific value
of 27,669 kJ/kg for this species. These findings have been linked to particle
size distribution, moisture content, volatile material content, ash content,
fixed carbon content, and calorific value (23). Another key
finding was that total leaf biomass emitted higher levels of CO₂, PM2.5, and TVOC than
total stem biomass. Leaf emissions of CO₂ exceeded stem emissions by 806.52 ppm
across the three species. For PM2.5,
a difference of 18.11 μg/m³ was observed between leaf and stem emissions.
However, stem biomass emitted 2,302.68 μg/m³ more PM₁₀ than leaf biomass across
the three evaluated species (table 3). In both cases, the emission levels exceeded the limits set by
NOM-025-SSA1-2021 for PM₁₀, even when averaged over 24 hours (25).
The values obtained were higher than those measured in the
environment during the study (table 3). This result should consider that the area is influenced by
stone extraction, agricultural activities, and climatic factors that can cause
environmental variability, even though the experiment was conducted under
controlled conditions. The biomass’s biomolecular components are
lignocellulosic, comprising cellulose, hemicellulose, and lignin, which have
recognized potential for bioenergy systems (4,
22, 50). Some authors have studied biomass’ potential as a fuel source,
emphasizing the importance of the chemical composition of different plant
types. Processes such as torrefaction, in which biomass is heated to
temperatures between 200 and 300°C, can enhance its energy properties (18). PM2.5 emissions in Thailand
have been reported to range from 0 to over 4,001 milligrams per year,
considering contributions from agricultural residue burning, forest fires, and
open biomass burning (50). Factors
influencing particle numbers include tree species and combustion rate, which
reflect the materials’ slow-to-fast burning capacity, such as wood, leaves, and
branches (21, 54). The most prominent emission produced
during biomass combustion is CO₂, which serves as a proxy for the biomass
carbon content and as a principal greenhouse gas. Combustion efficiency is
often assessed based on the amount of carbon oxidized to CO₂. While biomass
generally contains about 45% carbon weight, coal typically contains over 60% (24,
26).
Leaf
Emissions of Three Tree Species
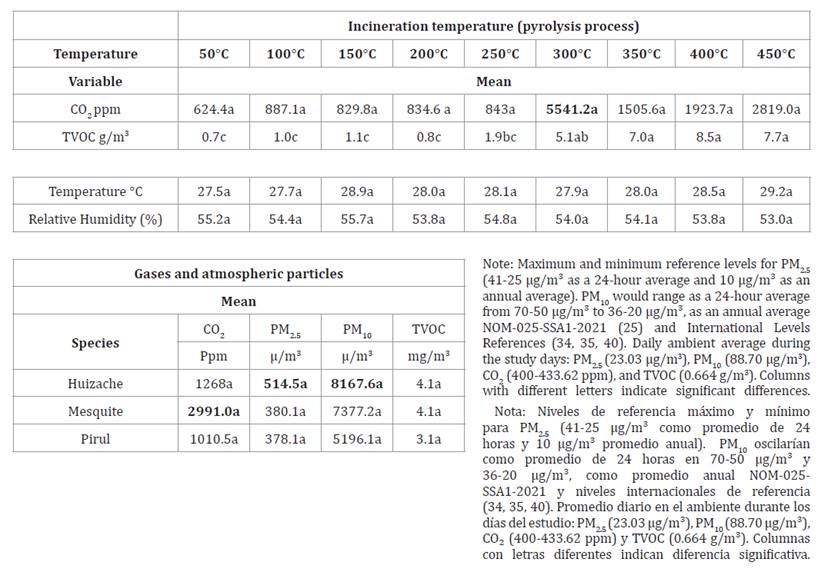
There was significant variation in gas and particle emissions
during the leaf BB for the three species (Tukey, p≤0.05). Table 3, shows that CO₂
emissions were higher at an incineration temperature of 300°C, with a
difference of 4916.8 ppm compared to the emissions reported at 50°C (5541.2
ppm). The maximum emission detected exceeds the atmospheric concentration of
512 ppm reported in technical documents by 13.44 times (17). The highest PM10
emission occurred at 450°C, at 22,910.8 μ/m³, showing a
significant difference of 22,683.4 μ/m³ relative to values at 150°C (figure 2B). In this case,
the estimated 24-hour average concentration was 954.61 μg/m³, which is 13.78
times higher than the 70 μg/m³ and 19.09 times higher than the 50 μg/m³
permissible limit established by the Mexican Official Standard
NOM-025-SSA1-2021 for this type of particulate matter (25). The highest
concentration of PM2.5 emissions was recorded at
350°C, reaching 869.1 μg/m³. This represents an 852.5 μg/m³ difference compared
to the 16.6 μg/m³ emission recorded at 150°C (figure 2A).

The
data shown refers to the mean ± standard error (different letters indicate significant
differences).
Los
datos representados refieren la media ± error estándar (letras diferentes
indican diferencia significativa).
Figure
2. Ratio of PM2.5 (A) and PM10 (B) emissions in leaves of three tree species
according to different incineration temperatures (Tukey, p≤0.05, n=81).
Figura
2. Relación emisiones de PM2.5 (A) y PM10 (B) en
hojas de tres especies arbóreas de acuerdo con las diferentes temperaturas de
incineración (Tukey, p≤0,05, n=81).
Based on this peak value, the estimated 24-hour average
concentration is 36.21 μg/m³, not exceeding the maximum limit of 41 μg/m³, but
if the minimum limit of 25 μg/m³ (1.39 times) established by NOM-025-SSA1-2021 (25). Table 4, shows atmospheric
gas and particle emissions from tree species of leafy biomass origin. P.
laevigata had higher CO₂ emissions, with a significant difference of
1,980.5 ppm compared to S. molle leaves. This difference is 4.8 times
higher than the reported average atmospheric concentration (412 ppm) (17). The leaves of A.
farnesiana emitted higher levels of PM2.5 and PM10 than those of the other
species. A. farnesiana had the highest PM10 emissions at 8,167.6
μ/m³, which is 4.86 times higher than the maximum limit (41 μ/m³) and 6.80
times minimum limit (50 μ/m³) established by NOM-025-SSA1-2021. The
corresponding 24-hour average would be 340.31 μ/m³. A pairwise comparison
between A. farnesiana and S. molle revealed that PM2.5
was 136.4 μ/m³ higher and PM10 was 2,971.5 μ/m³ higher
in A. farnesiana (table
4).
The highest PM2.5 value in A. farnesiana
(514.4 μ/m³) had a 24-hour average of 21.43 μ/m³, wich is well below the
limit specified in NOM-025-SSA1-2021 (25). Regarding the ash
generated from the total incinerated leaf biomass (g), S. molle was
significantly higher (0.444a) than A. farnesiana (0.349b) and P.
laevigata (0.294) (Tukey, p≤0.05).
Table 4. Ratio
of gas emissions and total atmospheric particulate matter from burning leaves
of three tree species (Tukey, p≤0.05, n=81).
Tabla
4. Relación de emisiones de gases y
partículas atmosféricas totales de la quema de hojas de tres especies arbóreas
(Tukey, p≤0,05, n=81).
Stem
Emissions of the Three Tree Species
Table 5 (Tukey, p≤0.05)
shows significant differences in gas particle emissions from stem biomass. The
highest mean total volatile organic compound (TVOC) emission occurred between
300°C and 450°C, reaching 8.2 g/m³.
Table 5. Ratio
of gas emissions and total atmospheric particulate matter from the burning of
stems of three tree species (Tukey, p≤0.05, n=54).
Tabla
5. Relación de emisiones de gases y
partículas atmosféricas totales de la quema de tallos de tres especies arbóreas
(Tukey, p≤0,05, n=54).
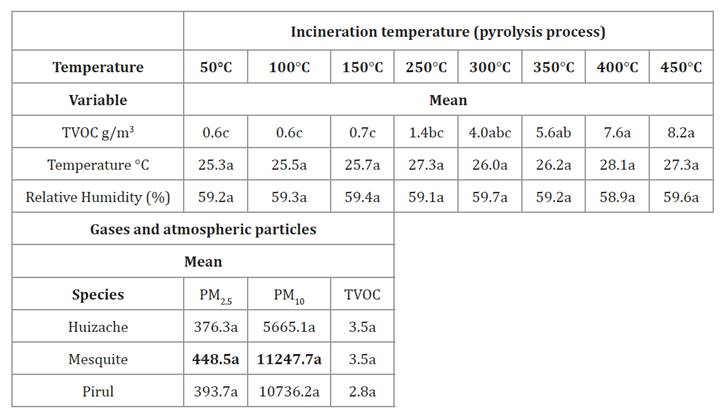
The highest CO₂ emission was observed at 450°C, with a
concentration of 1,284.3 ppm. This represents a difference of 632.3 ppm
compared to the emission at 50°C. S. molle had the highest mean CO₂
emissions (1,122.4 ppm), which was 338.06 ppm higher than the remaining
species, such as mesquite (figure
3).

The
data shown refers to the mean ± standard error (different letters indicate
significant differences).
Los
datos representados refieren a la media ± error estándar (letras diferentes
indican diferencia significativa).
Figure
3. Ratio of CO₂ emissions (A) according to different
incineration temperatures and CO₂ (B) in related stems and the three species of
stem origin (Tukey, p≤0.05, n=81).
Figura
3. Relación emisiones de CO₂ (A) de
acuerdo con las diferentes temperaturas de incineración y CO₂ (B) en tallos en
relación con las tres especies de origen del tallo (Tukey, p≤0,05, n=81).
Based on S. molle’s emissions at 450°C, atmospheric CO₂
concentrations would be between 2.5 and 2.7 times the normal level (17). The highest PM10
emissions occurred at 400°C (26,787.8 μ/m³), differing in
26,710.4 μ/m³ relative to emissions at 150°C (figure 4).

The
data shown refers to the mean ± standard error (different letters indicate
significant differences).
Los
datos representados refieren a la media ± error estándar (letras diferentes
indican diferencia significativa).
Figure
4. Ratio of PM2.5 (A) and PM10 (B) emissions in the stems of three tree
species according to different incineration temperatures (Tukey, p≤0.05, n=81).
Figura
4. Relación de emisiones de PM2.5 (A) y PM10 (B) en
tallos de tres especies arbóreas de acuerdo con las diferentes temperaturas de
incineración (Tukey, p≤0,05, n=81).
Averaging this peak over 24 hours (1,116.15 μ/m³) shows that the
NOM-025-SSA1-2021 (25) standard is
exceeded by 15.94 times (maximum level 70 μ/m³) and 22.32 times (minimum level
50 μ/m³). As for PM2.5,
the highest emissions occurred between 300 and 400°C. The peak value was 997.5
μg/m³, representing a significant mean difference of 989.4 μg/m³ relative to
emissions at 50°C. This elevated emission would result in a 24-hour average
concentration of 41.56 μg/m³, which exceeds the NOM-025-SSA1-2021 limit by a
factor of 0.56 μg/m³, the maximum level of 41 μ/m³ and 1.66 times the minimum
level of 25 μ/m³ (25). The ratio of
residual ash to total biomass differed significantly among species in stem
samples. A. farnesiana had the highest ratio (0.427 g), followed by P.
laevigata (0.325 g) and S. molle (0.265 g), according to Tukey’s
test at p ≤ 0.05. Biomass burning causes a loss of organic matter and nutrients
from the soil through particle dispersion or volatilization. BB leads to the
loss of nutrients, soil biota, and total nitrogen (N) and carbon (C) in the
topsoil, and it promotes soil erosion. Although nutrients are retained in ash,
ash deposition increases the pH of the surface layer. The presence of ash
increases surface concentrations of Ca, Mg, K, Na, and P; however, the high
solubility of basic cations enhances leaching and promotes soil crusting (30).
Principal
Component Analysis
In the leaf-biomass dataset for the three tree species, the
first three components explained 74% of the variance (figure 5A, 5B; 6A, and 6B). PC1 explained
31% of the variance, PC2 explained 29.7%, and PC3 explained 14%. PC1 was driven
by % relative humidity (0.528), TVOC (0.316), PM2.5 (0.284), and dry weight
(-0.440). PC2 was mainly associated with TVOC (0.509), PM2.5 (0.478), PM10
(0.478), and ambient temperature (0.326). PC3 was primarily
defined by CO₂ (0.758), ash weight (-0.540), and dry weight (-0.250). In the
stem biomass analysis, the first three PCs explained 80% of the variance. PC1
was mainly driven by PM2.5 (0.505), PM10
(0.488), CO₂ (0.442), and TVOC (0.467). PC2 accounted for 27% of
the variance and had positive loadings on dry weight (0.535) and temperature
(0.454), as well as negative loadings on % relative humidity (-0.619) and TVOC
(-0.296).

Figure
5. Eigenvalues resulting from principal component
analysis of the emission of gases and atmospheric particles from burning leaves
of three tree species according to species (A) and incineration temperature
(B).
Figura
5. Distribución de eigenvalores
resultante del análisis de componentes principales de la emisión de gases y
partículas atmosféricas de la quema de hojas de tres especies arbóreas de
acuerdo con la especie (A) y la temperatura de incineración (B).

Figure
6. Eigenvalues resulting from the principal component
analysis of the emission of gases and atmospheric particles from the burning of
stems of three tree species according to species (A) and incineration
temperature (B).
Figura
6. Distribución de eigenvalores
resultante del análisis de componentes principales de la emisión de gases y
partículas atmosféricas de la quema de tallos de tres especies arbóreas de
acuerdo con la especie (A) y la temperatura de incineración (B).
These findings
revealed significant variation in emission behavior among biomass components,
likely driven by differences in the physicochemical structure of leaf and stem
tissues across the three evaluated tree species. This variability was also
evident across incineration temperatures from 50°C to 450°C, both in the
analysis of total biomass and within the leaf and stem fractions. This
criterion is important because most emissions are concentrated in the
respirable fraction of PM. Emission size distribution and chemical
characteristics vary with appliance type, combustion rate, fuel moisture, and
biomass type; therefore, measurement is required to comply with air quality
standards (2). Particulate
matter (PM) is a key indicator of air pollution levels. The type of PM and the
ratio between size particles (fine and coarse) determine its effects on human
health and atmospheric processes. PM is commonly classified as dust, mixed
aerosols, and anthropogenic aerosols (28). Another relevant
observation is that leaf biomass from S. molle had the highest ash
content (0.44 ± 0.03 g), and stem biomass from A. farnesiana produced
the most ash among stems (0.42±0.06 g). Residual ash can have further
environmental impacts. Its accumulation and the combustion of organic matter
can significantly alter soil properties. For example, burned soils have a
darker color, which results in lower albedo, increased environmental heat
absorption, and higher soil temperature (30).
Complete combustion
and open-air burning of residues require sufficient heat flux, an adequate
oxygen supply, and sufficient combustion time. The magnitude and composition of
emissions from this type of combustion depend on factors such as fuel density,
moisture content, topography (e.g., slope and terrain profile), and
meteorological conditions (e.g., wind and precipitation) (48). Emissions from
major contributors to atmospheric particulate matter (PM), especially the PM2.5
and PM10 fractions, have been
linked to biomass burning (BB), forest fires, agricultural residue burning, and
motor vehicles. These associations highlight challenges and inform policy
recommendations for improving air quality (50).
Burning biomass
fuels, especially wood-based ones, releases less CO₂ into the atmosphere than
burning coal (26). However, BB is a
major source of particulate matter and trace gases. Incomplete combustion
likely contributes to global warming, and its overall contribution to climate
change remains debated (9). Given the global
concern about air pollution, studies like this one can contribute not only to
our understanding of the impact of these reported levels on complex
environmental processes but also provide opportunities for integral
environmental improvements (35). Other studies
have linked PM10 emissions to phytotoxic
effects and elevated heavy metal concentrations (36). Additionally, BB
is a significant source of greenhouse gases (GHGs) and air pollutants (35). Another study
found that air pollutants generally impact plant species, causing
morphological, physiological, and biochemical damage (11).
In Mexico, anthropogenic emissions from stationary sources
account for 22.5% of PM10,
20.9% of PM2.5,
and 4.7% of VOCs. Area sources (pollutant sources that are too numerous and
dispersed to be classified as fixed sources) account for 73.0%, 73.3%, and 89%,
respectively. Mobile sources account for 4.5%, 5.8%, and 6.3%, respectively (47). The National Air
Strategy, under Axis 5 (Responsible and Participatory Society), seeks to
establish mechanisms for the community to understand air pollution impact and
actively participate in improving air quality. It is recognized that the most
commonly used solid fuels in Mexico are biomass, agricultural waste, and
primarily firewood, accounting for 80% of the energy consumed in rural
households (47). Therefore, it is
crucial to acknowledge the risks and impacts that the emissions and residues of
these gases and particles pose to public health and ecosystems. Evidence from
PM10 studies includes data on
indoor smoke dispersion among household members engaged in activities such as
cooking, doing chores, warming up by the stove, playing, resting, eating, and
sleeping. These studies demonstrated an exposure-response relationship, with a
higher rate of increase for daily exposures below 1,000–2,000 μg/m³ (27). Figure 7 shows how this
pilot experiment clarifies the interplay between environmental factors and
biomass intrinsic physicochemical characteristics (as in the three evaluated
species) and the behavior of biomass components (leaves and stems) during
pyrolysis across the laboratory-scale temperature range. The experiment also
evaluates atmospheric gases and particles for regulatory compliance and
highlights opportunities to extend the study to open field conditions and
incorporate additional variables of interest.

Figure
7. Summary of the main results of the study on
atmospheric emissions from tree species (own elaboration).
Figura
7. Resumen de los principales
resultados del estudio sobre las emisiones atmosféricas de las especies
arbóreas (elaboración propia).
Conclusions
This study experimentally verified the environmental impacts of
biomass burning for three tree species under a laboratory pyrolysis process.
The emissions of PM2.5,
PM10, CO₂, and
total and specific VOCs varied between leaves and stems. This likely reflects
the anatomical and physicochemical differences in the biomass that affect
combustion at different incineration temperatures (50°C to 450°C). The highest
PM2.5 and PM10 emissions occurred in A.
farnesiana leaves and in P. laevigata stems. The order of highest
CO₂ emissions in leaves was P. laevigata > A. farnesiana > S.
molle; in stems, it was S. molle > A. farnesiana > P.
laevigata. The PM2.5,
PM10, and CO₂
levels observed in this study exceeded the limits established by Mexican and
international air quality regulations. CO₂ levels exceeded the technical
reference for atmospheric averages (412 ppm) by 8.83 times and the average
level in the study area by 8.39 times. PM₁₀ exceeded the limit allowed by
Mexican environmental regulations and international references (e.g.,
the World Health Organization) by 12.74 times (maximum level) and 17.84 times
the minimum level, as well as the level in the environment adjacent to the
study area by 10.05 times. Similarly, the level of PM2.5 does not exceed the
permitted 24-hour maximum limit. However, with the minimum reference level,
this limit is 1.50 times higher. The biomass emissions were 39.30 times higher
than those measured in the area surrounding the study site. These elevated
concentrations pose significant environmental risks and potential public health
impacts. They can also harm ecosystems, including phytotoxic effects on plants
and broader environmental degradation. Future studies should evaluate
differences in residual ash quantities and compare biomass burning technologies
and processes, as these differences may introduce additional environmental
impacts. Experimental limitations include the need to standardize the mass of
biomass and the size of samples when comparing materials such as leaves and
stems. This is where variables such as fresh weight, dry weight, and moisture
content are critical. To obtain more reliable results across samples,
especially when comparing laboratory and field emissions, environmental
conditions (temperature, humidity, wind speed, and solar radiation) and proper
instrument calibration must also be considered. These results can inform
assessments of the environmental impacts of using plants as an energy source
and support the integration of additional environmental variables into future
research and air pollution monitoring programs. Further comparisons across
biomass burning sources and processes should strengthen evaluations of
environmental impact considering air pollution.
1. Aguiar, S.;
Enríquez Estrella, M.; Uvidia Cabadiana H. 2022. Residuos agroindustriales: su
impacto, manejo y aprovechamiento. AXIOMA. 1(27): 5-11.
https://doi.org/10.26621/ra.v1i27.803
2. Air Quality
Expert Group. 2017. The Potential Air Quality Impacts from Biomass Combustion.
https://uk-air.defra.gov.uk/assets/documents/reports/cat11/1708081027_170807_
AQEG_Biomass_report.pdf%20
3. Alcalá Jáuregui,
J.; García Arreola, M. E.; Rodríguez Ortiz, J. C.; Beltrán Morales, F. A.;
Villaseñor Zuñiga, M. E.; Rodríguez Fuentes, H.; Hernández Montoya, A. 2013.
Vegetación bioindicadora de metales pesados en un sistema semiárido. Revista de
la Facultad de Ciencias Agrarias. Universidad Nacional de Cuyo. Mendoza.
Argentina. 45(1): 27-42.
4. Alcalá Jáuregui,
J.; Rodríguez Ortíz, J. C.; Hernández Montoya, A.; Filippini, M. F.; Martínez
Carretero, E.; Diaz Flores, P. E. 2018a. Capacity of two vegetative species of
heavy metal accumulation. Revista de la Facultad de Ciencias Agrarias.
Universidad Nacional de Cuyo. Mendoza. Argentina. 50(1): 123-139.
5. Alcalá Jáuregui,
J.; Rodríguez Ortiz, J. C.; Hernández Montoya, A.; Filippini, M. F.; Martínez
Carretero, E.; Díaz Flores, P. E.; Rojas Velázquez, A. N.; Rodríguez-Fuentes,
H.; Beltrán Morales, F. A. 2018b. Heavy metals in atmospheric dust deposited in
leaves of Acacia farnesiana (Fabaceae) and Prosopis laevigata (Fabaceae).
Revista de la Facultad de Ciencias Agrarias. Universidad Nacional de Cuyo.
Mendoza. Argentina. 50(2): 173-185.
6. Alcalá Jáuregui, J.; Rodríguez Ortiz, J. C.; Filippini, M.
F.; Martínez Carretero, E.; Hernández Montoya, A.; Rojas Velázquez, Á. N.;
Méndez Cortés, H.; Beltrán Morales, Felix A. 2022. Metallic elements in foliar
material and fruits of three tree species as bioindicators. Revista de la Facultad
de Ciencias Agrarias. Universidad Nacional de Cuyo. Mendoza. Argentina. 54(2):
61-72. https://doi.org/10.48162/rev.39.083
7. Alcalá Jáuregui,
J. A.; Ochoa Arriaga, A.; Martínez Carretero, E.; Navas Romero, A.; Ontivero,
M.; Filippini, M. F.; Rojas Velázquez, A. N.; Guillén Castillo, O. I.; Lara
Izaguirre, A. Y.; Duplancic, A.; Villegas Rodríguez, F. 2024. Evaluación de
emisiones de CO2 y
partículas finas en la incineración de biomasa de calabacita (Cucurbita pepo
L.-Cucurbitaceae). Multequina 33: 105-120.
http://id.caicyt.gov.ar/ark:/s18527329/wviayjl94
8. Ali, F., Dawood,
A.; Hussain, A.; Alnasir, M. H.; Khan, M. A.; Butt, T. M.; Janjua, N. K.;
Hamid, A. (2024). Fueling the future: biomass applications for green and
sustainable energy. Discover Sustainability.
https://doi.org/10.1007/s43621-024-00309-z
9. Almsatar, T.
2020. Environmental Issues of Biomass-Burning in Sub-Saharan African Countries.
In: Mammino, L. (eds). Biomass Burning in Sub-Saharan Africa. Springer.
https:// doi. org/10.1007/978-94-007-0808-2_1
10. Amodio, M.;
Andriani, E.; Dambruoso, P.; Daresta, B.; de Gennaro, G.; Gilio, A.; 2012.
Impact of biomass burning on PM10 concentrations. Fresenius Environ.
Bull. 21: 3296-3300.
11. Anand, P.;
Mina, U.; Khare, M.; Kumar, P.; Kota, S. H. 2022. Air pollution and plant
health response-current status and future directions. Atmospheric Pollution
Research. 13(6): 101508. DOI: 10.1016/j.apr.2022.101508
12. Arteaga, J.;
Arenas, E.; López, D.; Sanchéz, C.; Zapata, Z. 2012. De la pirólisis rápida de
residuos de palma africana (Elaeis guineensis Jacq). Biotecnología en el
Sector Agropecuario y Agroindustrial. 10(2): 144-151.
http://www.scielo.org.co/pdf/bsaa/v10n2/ v10n2a17.pdf
13. Arteaga-Pérez,
L. E.; Segura, C.; Santana, K. D. 2016. Procesos de torrefacción para
valorización de residuos lignocelulósicos. Análisis de posibles tecnologías de
aplicación en Sudamérica. Afinidad. 73(573).
14. Baray, M. del
R. 2016. Pirólisis a abaja temperatura en materiales avanzados de la pomasa de
manzana para la producción de biocombustibles. Centro de Investigación en
Materiales Avanzados.
https://cimav.repositorioinstitucional.mx/jspui/handle/1004/363
15. Basu, P.;
Sadhukhan, A. K.; Gupta, P.; Rao, S.; Dhungana, A.; Acharya, B. 2014. An
experimental and theoretical investigation on torrefaction of a large wet wood
particle. Bioresource technology. 159: 215-222.
16. Bergman, P. C.
2005. Combined torrefaction and pelletisation. The TOP process. ECN-C-05-073.
17. Buis, A. 2019.
The Atmosphere: Getting a Handle on Carbon Dioxide-Climate Change: Vital Signs
of the Planet. Retrieved December 6, 2020. https:// climate.nasa.gov/news/2915/
the-atmospheregetting-a-handle-on-carbon-dioxide/
18. Bustamante
García, V.; Carrillo Parra, A.; Prieto Ruíz, J. A.; Corral-Rivas, J. J.;
Hernández Díaz, J. C. 2016. Química de la biomasa vegetal y su efecto en el
rendimiento durante la torrefacción: Revisión. Revista mexicana de Ciencias
Forestales. 7(38): 5-23. http://www.scielo.org. mx/
scielo.php?script=sci_arttext&pid=S2007-11322016000600005&lng=es&tlng=es.
19. Chang, D.; Li,
Q.; Wang, Z.; Dai, J.; Fu, X.; Guo, J.; Zhu, L.; Pu, D.; Cuevas, C. A.;
Fernandez, R. P.; Wang, W.; Ge, M.; Fung, J. C. H.; Lau, A. K. H.; Granier, C.;
Brasseur, G.; Pozzer, A.; Saiz-Lopez, A.; Song, Y.; Wang, T. 2024. Significant
chlorine emissions from biomass burning affect the long-term atmospheric
chemistry in Asia. National Science Review. 11(9): nwae285. https://doi.
org/10.1093/nsr/nwae28520
20. Chekchaki, S.;
Zaafour, M. D.; Chekchaki, N. 2025. Acacia farnesiana (L.) Willd:
Ecology, uses and phytochemical composition. African Journal of Biological
Sciences. 7(4): 547-566. https:// doi.org/10.48047/AFJBS.7.4.2025.547-566
21. Chen, J.; Li,
C.; Ristovski, Z.; Milic, A.; Gu, Y.; Islam, M. S.; Wang, S.; Hao, J.; Zhang,
H.; He, C.; Guo, H.; Fu, H.; Miljevic, B.; Morawska, L.; Thai, P.; LAM, Y. F.;
Pereira, G.; Ding, A.; Huang, X.; Dumka, U. C. 2017. A review of biomass
burning: Emissions and impacts on air quality, health and climate in China.
Science of the Total Environment. 579: 1000-1034. https:// doi.
org/10.1016/j.scitotenv.2016.11.025
22. Chuetor, S.;
Panakkal, E. J.; Ruensodsai, T.; Cheenkachorn, K.; Kirdponpattara, S.; Cheng,
Y. S.; Sriariyanun, M. 2022. Improvement of Enzymatic Saccharification and
Ethanol Production from Rice Straw Using Recycled Ionic Liquid: The Effect of
Anti-Solvent Mixture. Bioengineering. 9(3): 115.
https://doi.org/10.3390/bioengineering9030115
23. Cruz
Montelongo, C.; Herrera Gamboa, J.; Ortiz Sánchez, I.; Ríos Saucedo, J. C.;
Rosales Serna, R.; Carrillo-Parra, A. 2020. Caracterización energética del
carbón vegetal producido en el Norte-Centro de México. Madera y bosques. 26(2):
e2621971. https://doi.org/10.21829/ myb.2020.2621971
24. Demirbas, A.
2004. Combustion characteristics of different biomass fuels. Progress in
energyand combustion science. 30(2): 219-230.
25. Diario Oficial
de la Federación. 2021. NORMA Oficial Mexicana NOM-021-SSA1-2021. Salud
ambiental. Valores límite permisibles para la
concentración de partículas suspendidas PM10 y PM2.5 en el aire, ambiente y
criterios para su evaluación. https://rama.edomex. gob.
mx/sites/rama.edomex.gob.mx/files/files/NOM-025-SSA1-2021.pdf%20
26. Dula, M.;
Kraszkiewicz, A. 2025. Theory and Practice of Burning Solid Biofuels in
Low-Power Heating Devices. Energies. 18(1): 182.
https://doi.org/10.3390/en18010182
27. Ezzati, M.; Kammen, D. M. 2002. The health impacts of
exposure to indoor air pollution from solid fuels in developing countries:
Comprehension, gaps, and data needs. Environ Health Perspect. 110(11): 1057-68.
https://doi.org/10.1289/ehp.021101057
28. Fan, H.; Zhao,
C.; Yang, Y.; Yang, X. 2021. Spatio-Temporal Variations of the PM2.5/PM10
Ratios and Its Application to Air Pollution Type Classification
in China. Front. Environ. Sci. 9: 692440. DOI: 10.3389/fenvs.2021.692440
29.
García-Azpeitia, L.; Montalvo-González, E.; Loza-Cornejo, S. 2022.
Caracterización nutricional y fitoquímica de hojas, flor y fruto de Prosopis
laevigata. Botanical Sciences. 100(4): 1014-1024.
30. Grillo, G.;
Tabasso, S.; Cravotto, G.; van Ree, T. 2020. Burning Biomass: Environmental
Impact on the Soil. In: Mammino, L. (eds) Biomass Burning in Sub-Saharan
Africa. Springer. https://doi. org/10.1007/978-94-007-0808-2_2
31. Health Efects
Institute. 2024. State of Global Air 2024. Special Report.
32. Hua, C.; Ma,
W.; Zheng, F.; Zhang, Y.; Xie, J.; Ma, L.; Song, B.; Yan, C.; Li, H.; Liu, Z.;
Liu, Q.; Kulmala, M.; Liu, Y. 2024. Health risks and sources of trace elements
and black carbon in PM2.5 from 2019 to 2021 in
Beijing. Journal of Environmental Sciences. 142: 69-82. https://doi.
org/10.1016/j.jes.2023.05.023
33. IFC.
International Finance Corporation. 2017. Converting Biomass to Energy: A Guide
for Developers and Investors.
34. IQAir. Air
Visual. 2018. 2018 World Air Quality Report. Region & City PM2.5
Ranking. Region & City PM2.5 Ranking.
https://www.iqair.com/ dl/2018_world-air-quality-report-2018-en.pdf
35. IQAir. Air
Visual. 2023. 2023 World Air Quality. Region and City PM2.5 Ranking.
https://www.iqair. com/
dl/2023_World_Air_Quality_Report.pdf%20
36.
Moscoso-Vanegas, D.; Monroy-Morocho, L.; Narváez-Vera, M.; Espinoza-Molina, C.;
Astudillo- Alemán, A. 2019. Efecto fitotóxico del metraila particulado PM10
recolectado en el área urbana de la Ciudad de Cuenca, Ecuador.
Iteckne. 16(1): 12-20. https://doi.org/10.15332/ iteckne.v16i1.2157
37. Muhd, P. S. D.;
Cuelho, C. H. F.; Brondani, J. C.; Manfron, M. P. 2015. Chemical composition of
the Schinus molle L. essential oil and their biological activities.
Revista Cubana de Farmacia. 49(1): 132-143.
38. Naciones
Unidas. 2018. La Agenda 2030 y los Objetivos de Desarrollo Sostenible: una
oportunidad para América Latina y el Caribe. LC/G.2681-P/Rev.3.
39. Nhuchhen, D.
R.; Basu, P.; Acharya, B. 2014. A comprehensive review on biomass torrefaction.
Int. J. Renew. Energy Biofuels. 1-56.
40. Organización
Mundial de la Salud. 2021. Directrices mundiales de la OMS sobre la calidad del
aire: materia particulada (MP2.5 y
MP10), ozono, dióxido
de nitrógeno, dióxido de azufre y monóxido de carbono: resumen ejecutivo.
Organización Mundial de la Salud. https://iris. who.int/handle/10665/346062.
41. Pinakana, S.
D.; Raysoni, A. U.; Sayeed, A.; Gonzalez, J. L.; Temby, O.; Wladyka, D.;
Sepielak, K.; Gupta, P. 2024. Review of Agricultural Biomass Burning and its
Impact on Air Quality in the Continental United States of America.
Environmental Advances. Vol.: 16. https://doi. org/10.1016/j.envadv.2024.100546
42. Pintor-Ibarra,
L. F.; Alvarado-Flores, J. J.; Rutiaga-Quiñones, J. G.; Alcaraz-Vera, J. V.;
Ávalos-Rodríguez, M. L.; Moreno-Anguiano, O. 2024. Chemical and Energetic
Characterization of the Wood of Prosopis laevigata: Chemical and Thermogravimetric
Methods. Molecules. 29(11): 2587. https://doi.org/10.3390/molecules29112587
43. Reinhardt, T.
E.; Ottmar, R. D.; Castilla, C. 2001. Smoke impacts from agricultural burning
in a rural Brazilian town. Journal of the Air & Waste Management Association
(1995). 51(3): 443-450. https://doi.org/10.1080/10473289.2001.10464280
44. Sadaka, S.;
Johnson, D. M. 2011. Biomass Combustion. Cooperative Extension Service.
University of Arkansas. US Department of Agriculture and county governments
cooperating. FSA1056.
45. Saleem M. 2022.
Possibility of utilizing agriculture biomass as a renewable and sustainable
future energy source. Heliyon. 8(2): e08905.
https://doi.org/10.1016/j.heliyon.2022.e08905
46. Sangaré, D.;
Belandria, V.; Bostyn, S.; Moscosa-Santillan, M.; Gökalp, I. 2024.
Pyro-gasification of lignocellulosic biomass: online quantification of gas
evolution with temperature, effects of heating rate, and stoichiometric ratio.
Biomass Conversion and Biorefinery. 14(8): 9763-9775.
47. Secretaría de
Medio Ambiente y Recursos Naturales. 2016. Estrategia Nacional de Calidad del
Aire. ENCA. https://www.gob.mx/cms/uploads/attachment/file/195809/Estrategia_
Nacional_Calidad_del_Aire.pdf%20
48. Sivertsen, B.
2006. Air pollution impacts from open air burning. WIT Transactions on Ecology
and the Environment. 92.
49. Subils, M. J.
B.; Domínguez, F. B. 2000. NTP 549: El dióxido de carbono en la evaluación de
la calidad del aire interior. España: Centro Nacional de Condiciones de
Trabajo. 124p.
50. Suriyawong, P.; Chuetor, S.; Samae, H.; Piriyakarnsakul, S.;
Amin, M.; Furuuchi, M.; Hata, M.; Inerb, M.; Phairuang, W. 2023. Airborne
particulate matter from biomass burning in Thailand: Recent issues, challenges,
and options. Heliyon. 9(3): e14261. https://doi.org/10.1016/j.
heliyon.2023.e14261
51. Torres-Duque,
C.; Maldonado, D.; Pérez-Padilla, R.; Ezzati, M.; Viegi, G. 2008. Forum of
International Respiratory Studies (FIRS) Task Force on Health Effects of
Biomass Exposure. Biomass fuels and respiratory diseases: A review of the
evidence. Proceedings of the American Thoracic Society. 5(5): 577-590.
https://doi.org/10.1513/pats.200707-100RP
52. Tripathi, S.;
Yadav, S.; Sharma, K. 2024. Air pollution from biomass burning in India.
Environ Res Lett. 19:073007. https://doi.org/10.1088/1748-9326/ad4a90
53. Valencia, G.
M.; Anaya, J. A.; Caro-Lopera, F. J. 2022. Bottom-up estimates of atmospheric
emissions of CO2,
NO2, CO, NH3, and Black Carbon,
generated by biomass burning in the north of South America. Revista de Teledetección.
59: 23-47. https://doi.org/10.4995/raet.2021.15594
54. Wardoyo, A. Y.;
Morawska, L.; Ristovski, Z. D.; Marsh, J. 2006. Quantifcation of particle
number and mass emission factors from combustion of Queensland trees. Environ.
Sci. Technol. 40(18): 5696-5703.
55. WHO. 2023. Who
Ambient Air Quality Database, 2022 update: status report. https://www.who. int/publications/i/item/9789240047693
56. WHO. 2024.
Ambient (outdoor) air pollution. https://www.who.int/ news-room/fact-sheets/
detail/ambient-(outdoor)-air-quality-and-health%20//%20
57. Wu, Y.; Han,
Y.; Voulgarakis, A.; Wang, T.; Li, M.; Wang, Y.; Xie, M.; Zhuang, B.; Li, S.
2017. An agricultural biomass burning episode in eastern China: Transport,
optical properties, and impacts on regional air quality, J. Geophys. Res.
Atmos. 122: 2304-2324. DOI: 10.1002/2016JD025319
58. Zauli-Sajani, S.; Thunis, P.; Pisoni, E.; Bessagnet, B.;
Monforti-Ferrario, F.; De Meij, A.; Pekar, F.; Vignati, E. 2024. Reducing
biomass burning is key to decrease PM2.5 exposure in European
cities. Scientific reports. 14(1): 10210.
https://doi.org/10.1038/s41598-024-60946-2