Rev. FCA UNCuyo | 2026 | 58(2) | ISSN 1853-8665
Natural Resources and Environment
https://doi.org/10.48162/rev.39.223
Physicochemical Characteristics of Leachates from Soilless Substrates for Tomato (Solanum lycopersicum L.) Seedling Production
Características fisicoquímicas de los lixiviados de sustratos sin suelo para la producción de plántulas de tomate (Solanum lycopersicum L.)
Jorge Alonso Alcalá Jáuregui 1*,
Claudia Tiscareño Villa 1,
Ángel Natanael Rojas Velázquez 1,
Idrissa Diedhiou 2,
María Flavia Filippini 3,
Daniela Cónsoli 3,
Eduardo Martínez Carretero 4,
Juan Carlos Rodríguez Ortiz 1,
Hugo Magdaleno Ramírez Tobías 1
1 Universidad Autónoma de San Luis Potosí. Facultad de Agronomía y Veterinaria. Km. 14.5 Carretera San Luis-Matehuala Apdo. Postal 32 CP 78321 Soledad de Graciano Sánchez. S. L. P. México.
2 EARTH University. Limón Province. Mercedes. Costa Rica.
3 Universidad Nacional de Cuyo. Facultad de Ciencias Agrarias. Catedra Química Agrícola. Almirante Brown 500. M5528AHB. Chacras de Coria. Mendoza. Argentina.
4 IADIZA (CONICET). Geobotánica y Fitogeografía. Mendoza. Argentina.
* jorge.alcala@uaslp.mx
Abstract
Assessing agricultural water quality is fundamental to minimizing and mitigating irrigation's environmental impacts. Leachate dynamics and physicochemical parameters as environmental stress indicators were evaluated. For tomato (Solanum lycopersicum L.) seedling production, we used soilless substrates. The study evaluated four treatments: T1 (100% coconut fiber), T2 (75% coconut fiber + 25% perlite), T3 (100% peat moss), and T4 (75% peat moss + 25% perlite). A controlled irrigation regime lasted 16 days, including fertilizer and fungicide applications. We collected and analyzed 192 leachate samples for eight parameters. Measured parameters included pH, electrical conductivity (EC), total dissolved solids (TDS), Na⁺, NO₃⁻, K⁺, and Ca²⁺. T3 showed the highest average volume retained (AVR). T2 exhibited the highest average leachate volume (AVL). Nitrate concentrations were higher in T4 and lower in T1, exceeding regulatory limits. Concentrations of Na⁺, K⁺, and NO₃⁻ posed contamination risks. These findings highlight the need for improved monitoring to enable safe agricultural reuse.
Keywords: Substrate mixtures, total dissolved solids (TDS), nitrates, reference levels
Resumen
La evaluación de la calidad del agua para uso agrícola es fundamental. Minimiza el impacto ambiental del riego y mitiga estos problemas. Este estudio evaluó la dinámica de los lixiviados y los parámetros fisicoquímicos como indicadores de estrés ambiental. Utilizamos sustratos sin suelo para la producción de plántulas de tomate (Solanum lycopersicum L.). El estudio evaluó cuatro tratamientos: T1 (100 % fibra de coco), T2 (75 % fibra de coco + 25% perlita), T3 (100% turba) y T4 (75% turba + 25 % perlita). Se aplicó un régimen de riego controlado durante 16 días, incluyendo aplicaciones de fertilizantes y fungicidas. Recogimos y analizamos 192 muestras de lixiviados para ocho parámetros. Los parámetros medidos incluyeron el pH, la conductividad eléctrica (CE), los sólidos totales disueltos (STD), Na⁺, NO₃⁻, K⁺ y Ca²⁺. T3 mostró el mayor volumen medio retenido (AVR). T2 presentó el mayor volumen medio de lixiviados (AVL). Las concentraciones de nitrato fueron más altas en T4 y más bajas en T1, superando los límites reglamentarios. Las concentraciones de Na⁺, K⁺ y NO₃⁻ planteaban riesgos de contaminación. Estos hallazgos ponen de relieve la necesidad de mejorar la supervisión para permitir una reutilización agrícola segura.
Palabras clave: Mezclas de sustratos, sólidos disueltos totales, nitratos, niveles de referencia
Originals: Received: 03/06/2025 - Accepted: 07/05/2026
Introduction
Assessing agricultural water quality is fundamental to preventing and mitigating environmental impacts. Agriculture dominates groundwater and surface water use. These resources are being overexploited worldwide (Moxey, 2012; Ongley, 1996; Yadav, 2024). Water scarcity is a priority in arid areas, particularly considering crops´ use 65% of applied water (Wahb-Allah & Al-Omran, 2012). Major impacts include agricultural leaching, erosion, and excessive nutrient losses, mainly caused by high nitrate concentrations.
Nitrate is a key indicator for evaluating agri-environmental policies (Kronvang et al., 2020; Moxey, 2012; OMS, 2006). Considering irrigated areas will likely increase, to mitigate water shortages, we must increase water efficiency and use marginal water (reclaimed, saline, or drainage) for irrigation. Fertigation enables this approach (UNESCO, 2025). Considering that about 25% of the world's surface water is polluted, monitoring quality parameters is necessary. However, in Mexico, official information about agricultural impacts on water resources is scarce. Data on pollution sources and inputs like fertilizers are limited (Aguilar & Pérez, 2008). Tomato is one of the most important vegetables in the world, with a per capita consumption of 20.2 kg (Pérez-Díaz et al., 2020).
Tomato production is the most significant national crop impacting water use. Mexico is the world's leading red tomato (Solanum lycopersicum L.) exporter, cultivating 49,522.18 ha and producing 3,636,927.46 tons. Sinaloa (19.6%), San Luis Potosi (12%), and Michoacan (9.8%) are the main producers (SEDARH, 2025). Exports mainly go to the United States and Canada (99.7%) (SIAP, 2022). Global demand will likely reach 11.78 million metric tons by 2030.
Average annual water requirements for tomatoes are 1,813 m³/ha. Requirements vary by system: 1,040 m³ for non-technified open fields and 8,461 m³ for technified ones (Rincón et al., 2016). Intensive tomato cultivation requires balancing fertigation efficiency and water quality. This balance is necessary for proper application and minimizing environmental impacts (Banjaw et al., 2017). Fertigation increases water use efficiency. In San Luis Potosi and Soledad de Graciano Sanchez (Mexico), groundwater availability for 5,000 ha is limited. Consequently, farmers use water from deep and shallow aquifers, alongside domestic and industrial wastewater (Sarabia-Meléndez et al., 2011). Irrigated areas suffer from waterlogging, desertification, salinization, and erosion. Water quality degradation from salts, agrochemicals, and toxic leachates is a serious problem (Moxey, 2012). Currently, soilless growing systems prioritize water and fertilizer efficiency. These systems respond to soil pathogens while allowing optimal plant growth control and high productivity (Gonnella & Renna, 2021). Global concern grows over recovering and recycling nutrients in food production. This is due to increasing natural resource consumption (Lucero-Sorbazo et al., 2022). Agricultural water waste contains nutrients, pesticides, sediments, organic matter, pathogens, and heavy metals (Mateo-Sagasta et al., 2017).
Quality analysis considers electrical conductivity (EC), total dissolved solids (TDS), pH, ions, and bacteria (Diaz et al., 2025). Studies have evaluated leachates in horticultural crops using substrates like vermicompost, sand, perlite, coconut fiber, and peat moss (Salas et al., 2003). Coconut fiber has a bulk density of 0.03-0.09, a pH of 4.9-6.1, and high-water retention. Perlite density ranges from 0.08 to 0.12 with a pH of 7 to 7.5. Peat moss has a density of 0.2-0.5, a pH of 4-7, and high-water retention (Mateo-Sagasta et al., 2017). Current technologies in agroecosystems must reduce the harmful effects of chemical fertilizers and improper waste disposal. Transforming agricultural practices provides solutions to immediate and long-term problems (Shanmugavel et al., 2023). This study evaluated the environmental implications of tomato (Solanum lycopersicum L.) seedling production. We quantified leachate volumes and characterized their physicochemical properties in different soilless substrates.
Materials and Methods
The study was conducted in the greenhouse at the Environmental Engineering Laboratory. This laboratory belongs to the Faculty of Agronomy and Veterinary, UASLP, Mexico. The site is located at km 14.5 of the San Luis Potosí-Matehuala highway, Ejido Palma de la Cruz. Its geographical coordinates are 22°14’05’’ N and 100°51'48” W, at an altitude of 1,836m ASL.
Physical Characterization of Substrates
We established a completely randomized experimental design with four treatments and three replications. The treatments included coconut fiber, perlite, and commercial peat moss. They were prepared as follows: T1 (100% coconut fiber), T2 (75% coconut fiber + 25% perlite), T3 (100% peat moss), and T4 (75% peat moss + 25% perlite). We used technical data for Kekkilä DSM 05 peat moss (LiTEC, 2025) and AGROLiTA™ perlite (Agrolita de México, 2023). Table 1 presents relevant information from these sheets. The coconut fiber was sieved before characterization. Measured parameters included bulk density, real density, particle size distribution (PSD), thickness index, pH, and EC. We followed UNE-EN 13041 standards for these determinations (AENOR, 2022). PSD was determined using a mechanical sieve with mesh sizes from 4.76 mm to 0.15 mm. We weighed the remaining fraction in each sieve. The thickness index was the sum of weights for fractions larger than 1 mm. Particles were classified by diameter: fine (<1 mm), medium (1-2.38 mm), and coarse (>2.38 mm). Total porosity was calculated using real and bulk density. All substrate analyses were performed at the faculty's Water and Soil Laboratory. Table 1 summarizes fiber characterization.
Table 1. Summary of some physical and chemical characteristics of the substrates used in the experiment.
Tabla 1. Relación de algunas características físicas y químicas de los sustratos utilizados en el experimento.
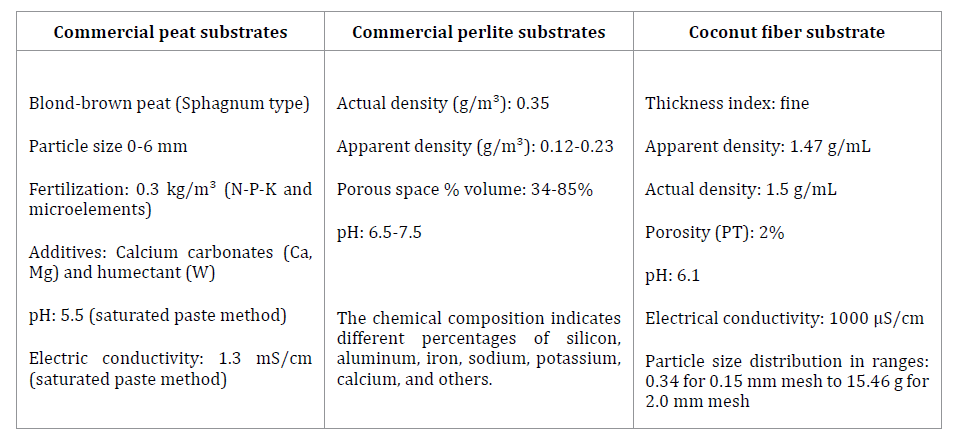
Peat moss and perlite data come from commercial technical sheets (LiTEC, 2025; Agrolita de México, 2023). Laboratory tests determined coconut fiber characteristics.
Los datos de la turba y la perlita provienen de fichas técnicas comerciales (LiTEC, 2025; Agrolita de México, 2023). Las pruebas de laboratorio determinaron las características de la fibra de coco.
Physical and Chemical Characterization
We determined pH and EC values using a HANNA HI99300 multiparameter meter. The saturation extract method used a 1:1 volume ratio of distilled water and substrate (300 mL each). We filtered the extract using 100 mm filter paper under vacuum. We ensured that the filtrate was clear to maintain reading accuracy.
Seedling Preparation
All substrates were prepared in 4-liter containers. We used four 200-cell seed trays (66 × 32 × 4 cm). Each treatment included three replicates, divided into 40-cell sections (5 × 8). Empty cell rows separated the treatments. We left edge cells empty to reduce the edge effect. Three individual trays under each seedbed collected residual water. We sowed two commercial tomato (Solanum lycopersicum L.) seeds per cavity. Normal irrigation continued until germination exceeded 60%. Subsequently, seedlings received 16 days of programmed irrigation. This included three applications of Amistar® Gold fungicide and Gro Green (20-30-10) fertilizer.
Irrigation Application
The irrigation program lasted 16 days with a frequency of every three days. We applied 750 mL of water per seedbed. Irrigation was controlled using 100 mL beakers and 5 mL syringes. The total volume was divided among the four treatments and their respective cavities. We prepared a four-liter solution for each application using 0.5 mL of fungicide and 1.5 mL of fertilizer. Each replicate received 750 mL of this solution via a foliar application. Fertilizer and fungicide were applied on days nine and fifteen. On day sixteen, we applied only the fertilizer solution. The irrigation water was pre-characterized using the same physicochemical parameters as the crop. Initial water quality values were Na⁺ (24.50±7.72 mg L-1), NO₃⁻ (55.3±42.6 mg L-1), K⁺ (14.25±2.06 mg L-1), and Ca²⁺ (59.5±33.9 mg L-1). We also measured pH (7.55±0.23), EC (231.50±7.07 μS cm-1), and TDS (115.0±3.46 ppm). Reference levels for irrigation water quality (CSR Laboratorio, 2023) indicate that EC values between 400 and 700 μS cm-1 pose no risk. Values below 400 or above 3000 μS cm-1 are risky. TDS (0-500 ppm) and pH (6.5-8.4) are within acceptable ranges. For Ca²⁺, levels below 150 mg L-1 are acceptable, but values above 70 mg L-1 require caution. Na⁺ (0-70 mg L-1) and K⁺ (0-20 mg L-1) levels are safe. For NO₃⁻, values of 0-20 mg L-1 are safe, while 130 mg L-1 is risky. Consequently, initial NO₃⁻ levels (20-130 mg L-1) require vigilance during the experiment.
Volumetric and Physicochemical Parameters
We collected leachates approximately four hours after post-irrigation to prevent evaporation. Based on previous studies (Yescas et al., 2011), we calculated several volumetric parameters. These included Total Volume Applied (TVA), Total Volume Retained (TVR), Total Volume Leached (TVL), and Leaching Retention Index (LRI). We measured TVL using 300 mL and 20 mL test tubes. TVR was calculated as TVA - TVL. We estimated the average retained volume (AVR) and average leached volume (AVL) by dividing TVR and TVL by the number of irrigations. LRI was calculated as TVR/TVA, and we also estimated the leaching percentage (PL = TVL/TVA*100). We measured pH, TDS (ppm), and EC (μS cm-1) using HQ40dMulti and HANNA HI99300 meters. LAQUAtwin portable meters measured Na⁺, NO₃⁻, Ca²⁺, and K⁺ ions (mg L-1). We estimated the total leachate volume (mL) using all samples and replicates over the 16 days.
Statistical Analysis
We performed statistical analyses using Minitab® software. A one-way analysis of variance (ANOVA) was conducted for selected parameters. We used Tukey’s test (p≤0.05) for mean comparisons. Additionally, we employed correlation and principal component analysis (PCA). These analyses explore relationships among variables and identify underlying patterns in the dataset.
Results and Discussion
Volumetric Indicators of Leachate
We analyzed 192 leachate samples. The total volume applied (TVA) was 48,000 ml. The total volume leached (TVL) reached 13,112 mL, resulting in a total volume retained (TVR) of 34,888 mL. This TVR represented 27.31% of the applied irrigation water. Tukey's test (p≤0.05) showed significant differences among volumetric variables for all treatments. T2 (75% coconut fiber + 25% perlite) yielded the highest TVL, AVL, and PL values. Conversely, T3 (100% peat moss) exhibited the highest TVR, AVR, and LRI (table 2). On average, T3 retained 579.87 mL (AVR). T2 showed the highest average leaching (AVL) with 247.75 mL and the highest percentage leached (PL). Differences between T3 and T2 were notable. T3 retained 77.31% of the TVA, resulting in an LRI of 0.77. This retention was 1,242 mL higher than T2. T2 obtained the lowest AVR and highest TVL, representing 33.03% of the TVA (3,964.0 mL).
Table 2. Relationship of leachate indicator behavior in the treatments and application of irrigation (n=64).
Tabla 2. Relación entre el comportamiento del indicador de lixiviados en los tratamientos y la aplicación de riego (n=64).
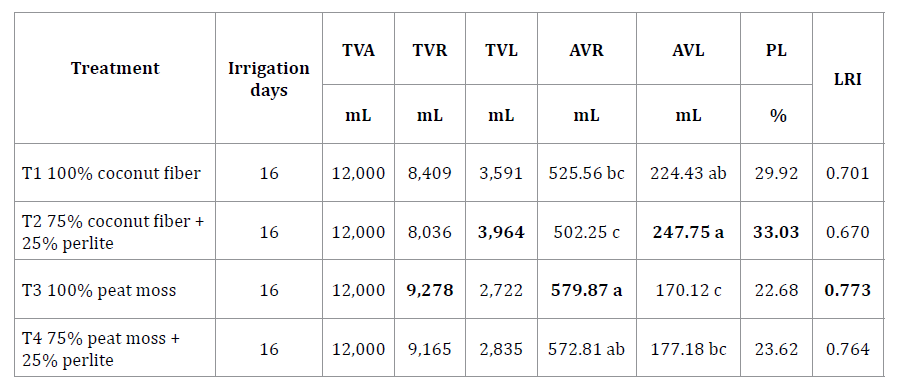
Different letters within a column indicate significant differences (Tukey, p ≤ 0.05). Variables include total volume applied (TVA), total volume retained (TVR), total volume leached (TVL), average volume retained (AVR), average volume leached (AVL), leaching percentage (PL), and leaching retention index (LRI).
Letras distintas en una misma columna indican diferencias significativas (Tukey, p ≤ 0.05). Las variables incluyen: volumen total aplicado (TVA), volumen total retenido (TVR), volumen total lixiviado (TVL), promedio del volumen retenido (AVR), promedio del volumen lixiviado (AVL), porcentaje de lixiviación (PL) e índice de retención de lixiviación (LRI).
Substrate characterization determined moisture content. Water retention occurred in both individual and combined substrates. The retention order was coconut fiber > coconut fiber + perlite > peat moss > peat moss + perlite > perlite. This order influences leachate indicators. Pore space and porosity distribution differ among substrates. These differences affect leachate volume regardless of irrigation frequency. Combining coconut fiber or peat moss with perlite increases porosity. Coconut fiber has 84.42% total porosity and 61% retention capacity. Peat moss mixed with perlite shows 81.82% porosity and 53.80% retention capacity (Quesada & Méndez, 2005). All four substrates contained fine particles. Real densities ranged from 1.5 to 1.53 g mL-1. In dry particles, most water passes quickly through pores before retention. Conversely, in wet particles, leached volume depends only on substrate characteristics (Yescas et al., 2011). Tomato irrigation requirements in greenhouses range from 200 mL per plant initially to 1,500 mL at maximum demand (Flores et al., 2007). Coconut fiber gravimetric humidity can reach 960%. Mixing it with inorganic materials significantly reduces this humidity (Gutiérrez-Castorena et al., 2011). Organic and inorganic mixtures at a 75:25 ratio retain the highest volumetric moisture (up to 98%). Coconut fiber contributes most to this retention. Mixtures at a 50:50 ratio retain 60-82%, while pure inorganic materials retain the least (Gutiérrez-Castorena et al., 2011).
Soilless systems typically show higher water and fertilizer losses. However, recirculating drains could reduce contamination (Salas et al., 2003).
Physicochemical Parameters
We performed a correlation analysis on 192 samples. Out of 28 interactions, 13 were significantly negative, and 9 were significantly positive (p≤0.05). The strongest positive correlations were TDS-EC (r²=0.964), TDS-K⁺ (r²=0.783), and EC-K⁺ (r²=0.779). The strongest negative correlation was pH-K⁺ (r²=-0.418). pH and EC are key parameters for substrate selection. They affect seedling rhizosphere development. These parameters and their interactions require constant analysis (Quesada & Méndez, 2005). Tukey's test (p≤0.05) showed significant mean differences among parameters. These differences vary by treatment and irrigation day (table 3 and figure 1).
Table 3. Results of mean concentrations of physicochemical parameters in leachate according to treatment (Tukey, p≤0.05, n=192).
Tabla 3. Resultados de las concentraciones medias de los parámetros fisicoquímicos en lixiviados de acuerdo con el tratamiento (Tukey, p≤0,05, n=192).
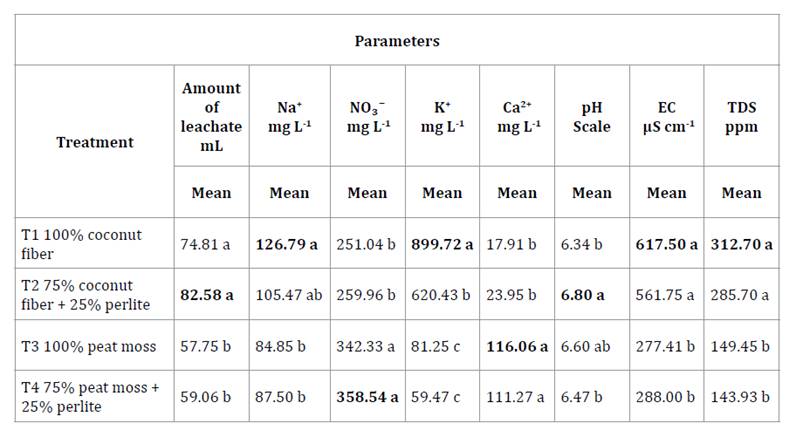
Means with different letters in the column indicate significant differences. Average of normal irrigation water applied: Na+ (24.50 ± 7.72 mg L-1), NO3⁻ (55. 3 ± 42.6 mg L-1), K+ (14.25 ± 2.06 mg L-1), Ca2+ (59.5 ± 33.9 mg L-1), pH (7. 55 ± 0.23), EC (231. 50 ± 7.07 μS cm-1), and TDS (115. 0 ± 3.46 ppm).
Medias con letras diferentes en columna indican diferencia significativa. Promedio del agua normal de riego aplicada: Na+ (24,50 ± 7,72 mg L-1), NO3⁻ (55,3 ± 42,6 mg L-1), K+ (14,25 ± 2,06 mg L-1), Ca2+ (59,5 ± 33,9 mg L-1), pH (7,55 ± 0,23), EC (231,50 ± 7,07 μS cm-1) y TDS (115,0 ± 3,46 ppm).
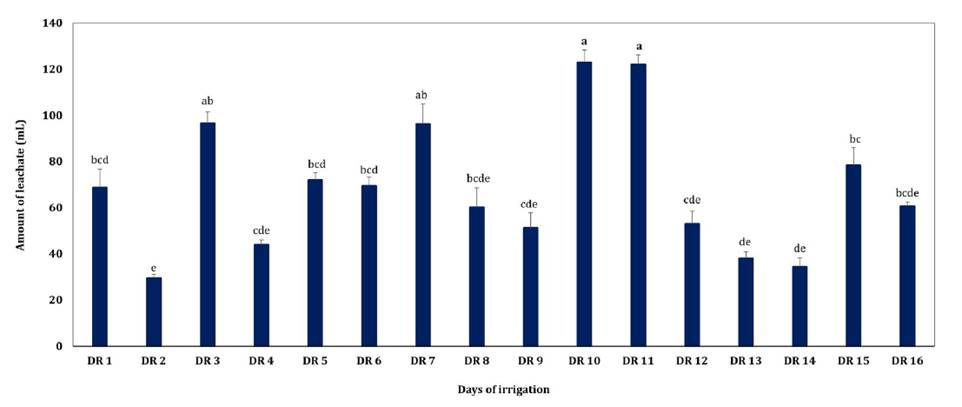
Means with different letters in the column indicate significant differences.
Medias con letras diferentes en columna indican diferencias significativas.
Figure 1. Amount of leachate according to the day of irrigation application in tomato seedling crop substrates (Tukey, p≤0.05; n=192).
Figura 1. Cantidad de lixiviados de acuerdo con el día de aplicación del riego en los sustratos del cultivo de plántulas de tomate (Tukey, p≤0,05; n=192).
T2 (75% coconut fiber + 25% perlite) recorded the highest average leachate volume (82.58 mL). T3 (100% peat moss) showed the lowest volume (57.75 mL). This 24.83 mL difference represents a 142.9% increase in leachate volume. Regarding physicochemical parameters (table 3), T1 (100% coconut fiber) had the highest concentrations of EC, TDS, Na⁺, and K⁺. T4 (75% peat moss + 25% perlite) showed the highest NO₃⁻ concentrations. Previous studies on coconut fiber and sargassum evaluated pH, EC, and Na⁺, K⁺, and Ca²⁺ content. Immersing these materials in water decreased harmful salts like Na⁺ and Cl⁻. However, soluble K⁺ content also reduced by more than 50%. Continuous water application effectively leached salts, resulting in lower EC values (Rodríguez et al., 2016). Another study compared coconut fiber powder with peat. Results showed differences between coconut fiber sources. Coconut fiber pH was slightly acidic. Salinity varied between 39 and 597 mS m-1 in saturated extracts. Nitrogen and calcium concentrations were low, while phosphorus and potassium concentrations were high. Chloride and sodium concentrations were also high (Abad et al., 2002).
Irrigation on the tenth day showed the highest volume (122.91 mL). The second day recorded the lowest volume (29.41 mL). This 93.50 mL difference represents a 417.91% increase. Table 4 highlights the days with maximum concentrations. EC, TDS, and Na⁺ were highest on the fourth day. NO₃⁻ and Ca²⁺ peaked on the thirteenth day. Significant differences exist in Na⁺, K⁺, Ca²⁺, and NO₃⁻ contents, pH, and EC between coconut fiber and peat moss mixtures (Quesada & Méndez, 2005). Consequently, parameter variations relate to substrate combinations and nutrient solutions.
Table 4. Concentration of physicochemical parameters in leachate according to irrigation day (Tukey, p≤0.05; n=192).
Tabla 4. Concentración de parámetros fisicoquímicos en lixiviados de acuerdo con el día de riego (Tukey, p≤0,05; n=192).
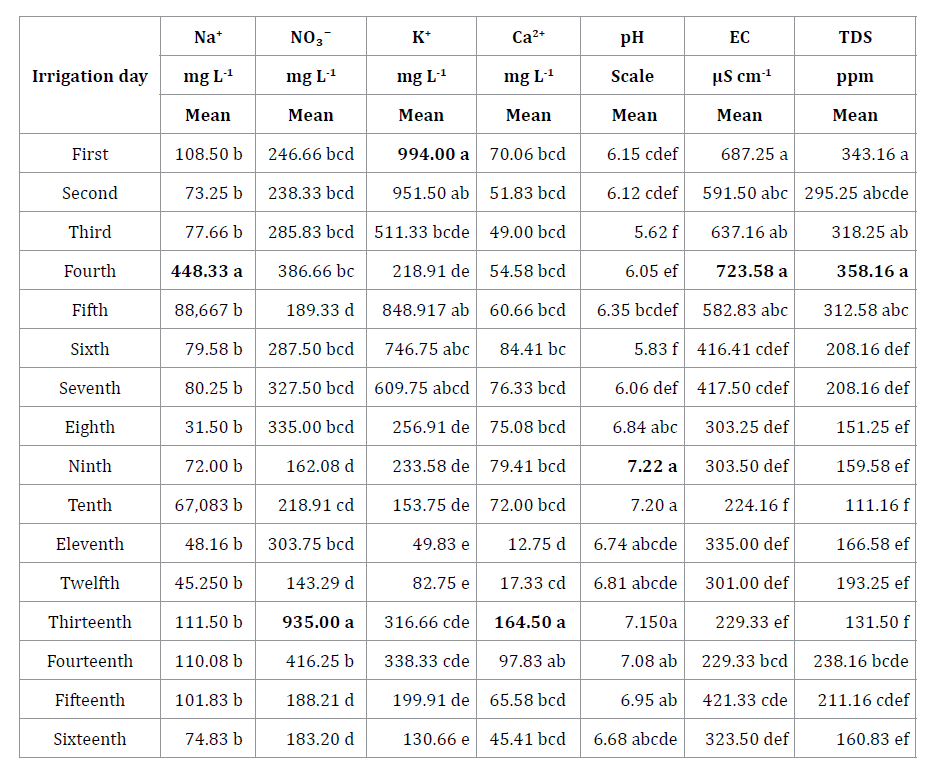
Different letters within a column indicate significant differences (Tukey, p ≤ 0.05). Average irrigation water values: Na⁺ (24.50±7.72 mg L-1), NO₃⁻ (55.3±42.6 mg L-1), K⁺ (14.25±2.06 mg L-1), and Ca²⁺ (59.50±33.9 mg L-1). Measured pH (7.55±0.23), EC (231.50±7.07 μS cm-1), and TDS (115.0±3.46 ppm). Fertilizer and fungicide were applied on days nine and fifteen. On day sixteen, only fertilizer was applied.
Letras distintas en una misma columna indican diferencias significativas (Tukey, p ≤ 0,05). Valores promedio del agua de riego: Na⁺ (24,50±7,72 mg L-1), NO₃⁻ (55,3±42,6 mg L-1), K⁺ (14,25±2,06 mg L-1) y Ca²⁺ (59,50±33,9 mg L-1). El pH fue de 7,55±0,23, la CE de 231,50±7,07 μS cm-1 y los STD de 115,0±3,46 ppm. El fertilizante y el fungicida se aplicaron los días nueve y quince; el día dieciséis solo se aplicó fertilizante.
Substrate characteristics influence these values. Fungicide and nutrient applications on days nine and fifteen also affect them (table 4). The first stage showed several contrasts among treatments and variables (figure 2). Although T2 obtained the highest leaching percentage (LP), pH was the only parameter of interest. In contrast, T1 (100% coconut fiber) showed higher TDS and EC values. This may be associated with coconut fiber particle release.
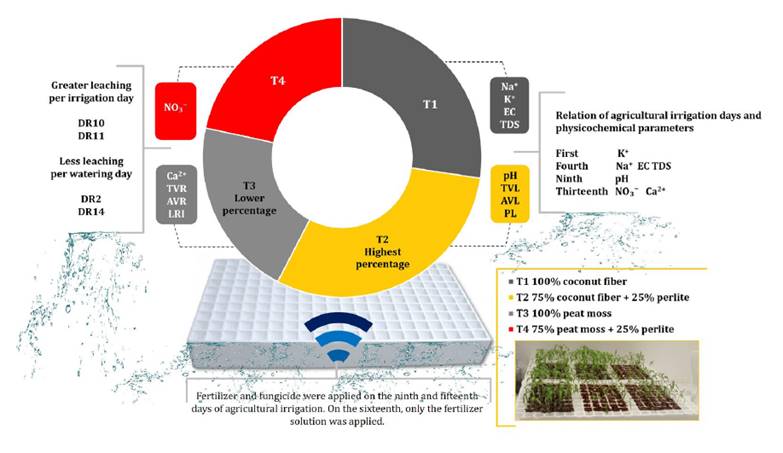
DR: irrigation day; TVR: total volume retained; AVR: average volume retained; LRI: leaching retention index. Source: Own elaboration.
DR: día de riego; TVR: volumen total retenido; AVR: volumen medio retenido; LRI: índice de retención de lixiviación. Fuente: Elaboración propia.
Figure 2. Volumetric variables and physicochemical parameters by substrate and irrigation day in tomato seedlings.
Figura 2. Variables volumétricas y parámetros fisicoquímicos según sustrato y día de riego en plántulas de tomate.
NO₃⁻ leaching in T4 (75% peat moss + 25% perlite) is relevant. Leachate concentrations did not increase despite the applications on day sixteen. This suggests seedling growth influenced parameter variations. Agronomic variables like root and stem size support this. Root size variations were not significant, ranging from 7.3 cm to 7.8 cm. However, the stem was significantly larger in T3 (6.66 cm) and smaller in T2 (4.6 cm). This analysis addresses the need for environmental impact studies on substrates. It focuses on waste, recycling, and remediation in horticulture (Kader et al., 2024).
This evaluation considered the following criteria: a) the highest and lowest amount found per treatment and irrigation days. b) the variation relative to the average concentration in the applied irrigation water. c) the percentage variation of the parameter over the highest amount and its reference level. These results are described below (table 5).
Table 5. Physicochemical parameter concentrations by treatment, irrigation day, and reference levels.
Tabla 5. Concentraciones de parámetros fisicoquímicos según tratamiento, día de riego y niveles de referencia.
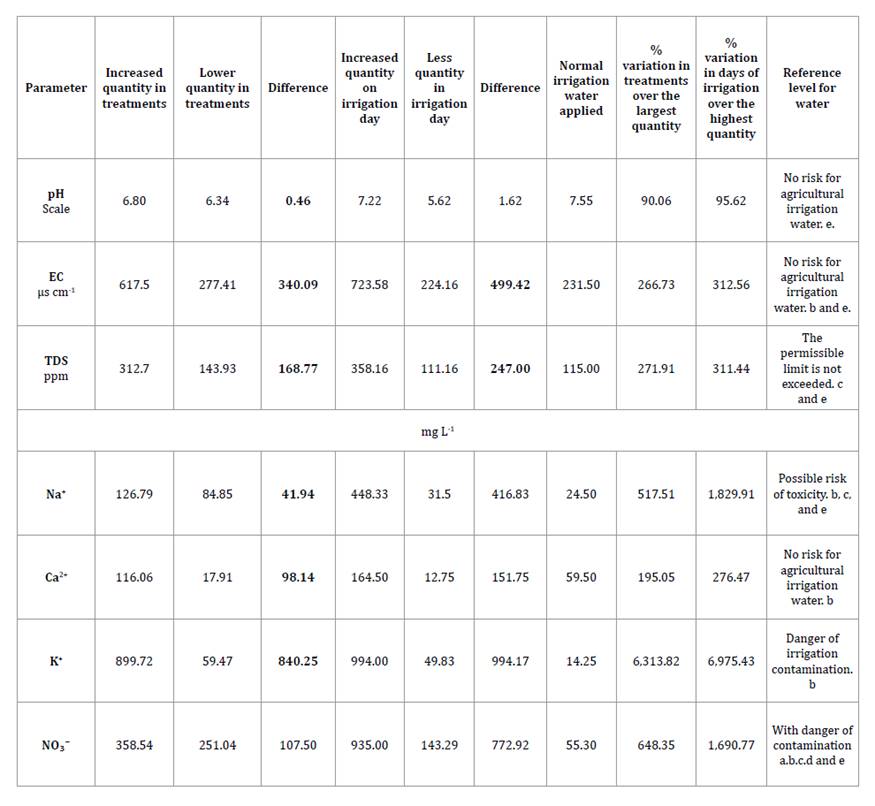
a: Programa Regulatorio Agrícola (2013); b: CSR Servicios (2006) and CSR Laboratorio (2023); c: NOM-127-SSA-1994 (DOF, 2022); d: Federal Law on Water Rights (CONAGUA, 2020); e: FAO Irrigation Guidelines (Ayers & Westcot, 1994).
a: Programa Regulatorio Agrícola (2013); b: CSR Servicios (2006) y CSR Laboratorio (2023); c: NOM-127-SSA-1994 (DOF, 2022), d: Ley Federal de Derechos de Agua (CONAGUA, 2020); e: Directrices de Riego de la FAO (Ayers & Westcot, 1994).
pH
Values ranged from 6.34 (T1) to 6.80 (T2). Over 16 days, leachate pH ranged from 5.62 to 7.22. This increase may relate to the first fungicide and nutrient applications. The original irrigation water averaged 7.55, which is within FAO quality guidelines (Aguilar Ibarra & Pérez Espejo, 2008). Treatment variation was 90.06%, while irrigation day variation reached 95.62%. These levels pose no risk for agricultural irrigation (CSR Laboratorio, 2023). In substrate management, pH decreases as particle size increases (Mixquititla-Casbis et al., 2022). Optimal nutrient absorption occurs between pH 5.0 and 6.5 (Durán et al., 2009). Substrate type, water alkalinity, and root activity affect these values. Fertilizer reaction also influences pH changes (Barbaro et al., 2018).
Electrical Conductivity (EC)
EC values ranged from 277.4 to 617.5 μS cm-1. T3 (100% peat moss) recorded the lowest value, while T1 (100% coconut fiber) showed the highest. The difference reached 340.1 μS cm-1. EC also varied by irrigation day. The highest value (723.5 μS cm-1) occurred on day four. The lowest (224.1 μS cm-1) occurred on day ten. This range (0.25-0.75 dS m-1) indicates moderate salinity (C2) according to the Riverside classification (Thorne & Peterson, 1996). These waters are usable with moderate leaching (Ayers & Westcot, 1994). Generally, special salinity control is unnecessary for moderately salt-tolerant plants (Cortés-Jiménez et al., 2009). EC levels below 1,000 μS cm-1 are risk-free. Values between 1,000 and 1,575 μS cm-1 indicate risk, while higher values pose danger (CSR Laboratorio, 2023). Our results show no salinity risk to crops. Substrate EC should ideally remain below 1 dS m-1 to facilitate fertilization and avoid phytotoxicity (Barbaro et al., 2018). Coconut fiber (0.90 dS m-1) and perlite (0.01 dS m-1) report low EC. This parameter varies by substrate type and tomato growth stage (Yescas et al., 2011).
Total Dissolved Solids (TDS)
TDS values ranged from 143.93 to 312.70 mg L-1. T4 recorded the lowest value, while T1 yielded the highest. This difference (168.77 mg L-1) is higher than the irrigation water average (115.0 mg L-1). The highest TDS (358.16 mg L-1) occurred on day four, and the lowest (111.16 mg L-1) on day ten. Treatment variation reached 271.91%, while irrigation day variation was 311.44%. None of these values exceeded the 1,000 mg L-1 permissible limit (NOM-127-SSA-2021). TDS concentration relates to anions and cations, expressed as EC (Sarabia Meléndez et al., 2011). For irrigation water, values up to 500 mg L-1 pose no issue (CSR Laboratorio, 2023). FAO guidelines (Ayers & Westcot, 1994) also consider levels up to 450 mg L-1 safe for agricultural use.
Sodium (Na⁺)
Leachate Na⁺ concentrations varied by treatment. T1 yielded the highest value (126.79 mg L-1), and T3 the lowest (84.50 mg L-1). Regarding irrigation days, Na⁺ peaked on day four (448.33 mg L-1) and was lowest on day eight (31.50 mg L-1). Both results exceeded the irrigation water average (24.50 mg L-1). Treatment variation was 517.51%, while irrigation days showed a 1,829.9% increase. Sodium levels in coconut fiber (363.65 mg L-1) are lower than in materials like sargassum (Gayosso-Rodríguez et al., 2018). Several mechanisms influence Na⁺ accumulation. These include roots, sodium-rich irrigation water, organic amendments, and fertilizers. Mineralization of organic matter and upward ion movement via evapotranspiration also contribute. Perlite, of volcanic origin, contains 1-4% Na2O (Camacho et al., 2021). The 200 mg L-1 limit (NOM-127-SSA1-2021) was only exceeded on irrigation day four. Na⁺ levels below 70 mg L-1 are risk-free. Levels between 70 and 300 mg L-1 pose a risk, and values over 300 mg L-1 indicate toxicity (CSR Laboratorio, 2023). Based on this criterion, treatments suggest toxicity risks. FAO guidelines (Ayers & Westcot, 1994) also indicate restrictions above 69 mg L-1.
Calcium (Ca²⁺)
Leachate Ca²⁺ values varied by treatment. They ranged from 17.91 mg L-1 (T1) to 116.06 mg L-1 (T3). Similarly, Ca²⁺ varied by irrigation day, ranging from 12.75 mg L-1 (day 11) to 164.50 mg L-1 (day 13). Differences across treatments (93.15 mg L-1) and irrigation days (151.75 mg L-1) exceeded the irrigation water average (59.5 mg L-1). T3 (100% peat moss) exceeded this average by 1.9 times. Previous studies report calcium concentrations lower than materials like henequen bagasse (Gayosso-Rodríguez et al., 2018). Peat moss mixtures typically contain calcium levels < 100 mg L-1 (Garbanzo-León and Vargas-Gutiérrez, 2014). Optimal substrate calcium levels should exceed 200 mg L-1 (Martínez-Florián & Roca, 2011). Treatment variation was 195%, and irrigation day variation was 276.47% relative to the applied water. FAO guidelines indicate that Ca²⁺ usually ranges from 0 to 401 mg L-1 (Ayers & Westcot, 1994). Ca²⁺ can counteract negative sodium effects, reducing sodicity risks. However, high Ca²⁺ levels increase water hardness and pipe clogging risks. Levels of 50 mg L-1 are risk-free, while values over 250 mg L-1 pose clogging dangers (CSR Laboratorio, 2023).
Potassium (K⁺)
Leachate K⁺ concentrations were high. T1 (100% coconut fiber) showed the highest value (899.72 mg L-1), while T4 (peat moss + 25% perlite) showed the lowest (59.47 mg L-1). This created an 840.25 mg L-1 difference across treatments. Potassium levels also varied by irrigation day, from 994 mg L-1 (day 2) to 49.83 mg L-1 (day 13). Both results exceeded the irrigation water average (14.25 mg L-1). T1 exceeded this average by 63.13 times. Potassium levels over 100 mg L-1 represent a contamination danger (CSR Laboratorio, 2023). This increase primarily results from the mineral composition of coconut fiber, a rich potassium source (Rincón et al., 2016).
Nitrates (NO₃⁻)
The highest NO₃⁻ concentration was 358.54 mg L-1 (T4), and the lowest was 251.04 mg L-1 (T1). Values ranged from 143.29 mg L-1 (day 12) to 935 mg L-1 (day 13). Differences across treatments (107.49 mg L-1) and irrigation days (791.70 mg L-1) were higher than the irrigation water average (55.3 mg L-1). T4 showed a 6.48-fold increase, while T1 increased 4.53 times. These levels exceed the 10.0 mg L-1 permissible limit (NOM-127-SSA-2021) and the 5.0 mg L-1 Federal Water Rights Law limit (CONAGUA, 2020; DOF, 2022; Valles et al., 2017). Nitrate levels must be considered during fertilization. For example, 700 m³ ha-1 of irrigation water at 25 mg L-1 contributes 40 kg of N ha-1. This could save fertilizer and reduce contamination risks (Sarabia-Meléndez et al., 2011). Surface waters typically have low NO₃⁻ (0-18 mg L-1), but high levels result from agrochemicals and industrial effluents (Valdés, 2015). NO₃⁻ levels between 50 and 100 mg L-1 pose risks, while values over 100 mg L-1 indicate high contamination (CSR Laboratorio, 2023; OMS, 2006). Excessive irrigation promotes leaching and increases nitrate contamination (Salas et al., 2003). In this study, T4 exceeded the 10 mg L-1 nitrogen threshold by 5.5 times and T1 by 7.9 times. All samples exceeded the FAO severe restriction level of 30 mg L-1 (Ayers & Westcot, 1994). This indicates a high contamination risk for nearby soil and water. High NO₃⁻ accumulation in plants can also affect consumers. NO₃⁻ can transform into NO₂⁻ in the human body, potentially causing methemoglobinemia in infants or forming carcinogenic compounds (Valdés, 2015).
Principal Component Analysis (PCA)
The PCA used 192 samples. It identified associations between parameter groups with positive and negative interactions. Figures 3a and 3b, show data associations by treatment. We observed three groups based on the treatments. Group one includes T1 (100% coconut fiber) and T2 (75% coconut fiber + 25% perlite). Group two includes T3 (100% peat moss) and T4 (75% peat moss + 25% perlite).
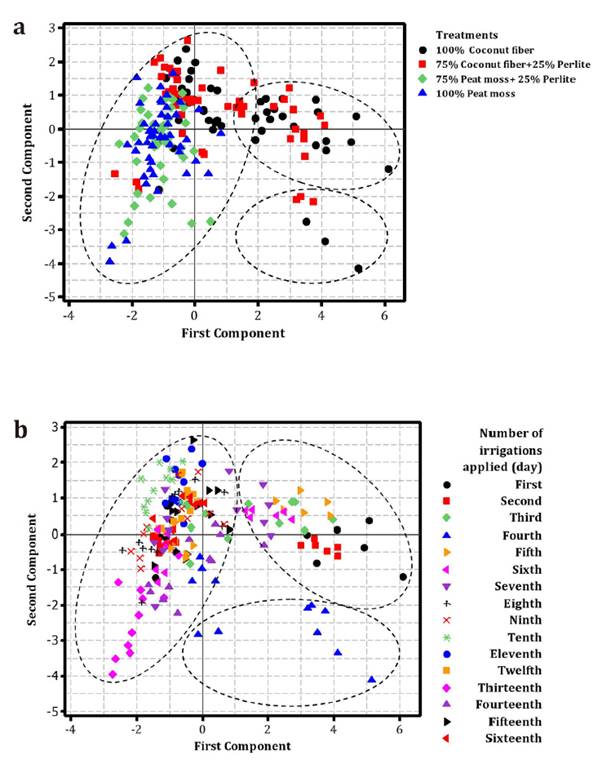
a) Irrigation application days b) derived from the physicochemical parameters evaluated in irrigation application and leachates.
a) Días de aplicación del riego b) derivada de los parámetros fisicoquímicos evaluados en la aplicación del riego y los lixiviados
Figure 3. Distribution of PCA points between treatments.
Figura 3. Distribución de puntos del PCA entre los tratamientos.
Figures 4a and 4b, show the vector analysis. This analysis presented three data groups and distinguished their influence on parameter behavior. This corroborates the correlation between variables, especially the relationship between EC and TDS.
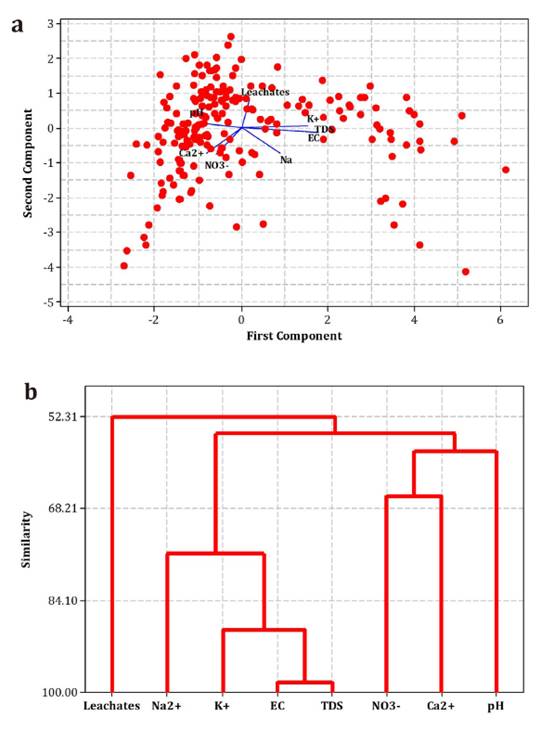
(a) Percentage similarity between parameters in leachates (b).
(a) Porcentaje de similitud entre parámetros en los lixiviados (b).
Figure 4. Physicochemical parameter distribution by treatment from PCA.
Figura 4. Distribución de parámetros fisicoquímicos por tratamiento mediante PCA.
Component Variation
The first three principal components (PC) explained 72.9% of the variation. PC1 accounted for 42.2%, PC2 for 19.4%, and PC3 for 11.2%. In PC1, EC (0.522), TDS (0.519), and K⁺ (-0.453) explained the most significant variation. For PC2, leachate volume (0.541) was a positive factor, while NO₃⁻ (-0.481), Na⁺ (-0.476), and Ca²⁺ (-0.472) were negative. For PC3, variations were driven by Ca²⁺ (0.523), leachate volume (0.285), and pH (-0.758).
These results confirm two main groups defined by treatments T1/T2 and T4. Data dispersion from the central axis is evident. This may result from the specific data groups in each PC (figures 3a and 3b, figures 4a and 4b). Nutrient solutions and fungicide applications likely influenced cluster behavior. Overwatering causes nutrient solution leaching, and economic losses for farmers. Overwatering also causes drastic changes in substrate pH and EC. Additionally, it leads to growing medium saturation, decreased photosynthesis, and nutritional imbalances. Excessive water promotes pathogen development and results in poor-quality fruits (Yescas et al., 2011). Monitoring these parameters is mandatory to control environmental risks to soils, plants, surface water, and groundwater (Alcalde-Sanz & Gawlik, 2017). Developing environmentally friendly substrates and control systems is essential for sustainable production (Tuxun et al., 2025).
Conclusions
Agricultural substrate use affects the volume and quality of residual leachates. This relationship is key to tomato seedling production. We observed significant variations in volumetric variables, particularly in applied, retained, and leached irrigation volumes. Physicochemical parameters also varied between applied and residual water. The 75% coconut fiber and 25% perlite treatment showed the highest water loss through leaching. This included total volume, average loss per irrigation, and drainage percentage. Conversely, this treatment had the lowest water storage capacity. In contrast, peat moss retained the largest amount of water, highlighting its superior moisture storage ability. These findings emphasize the critical role of substrate composition on water use efficiency. Excessive leaching has significant environmental implications. Substrate management must be adjusted to minimize water losses and reduce contamination risks. All treatments produced over 20% leachate despite controlled watering. This underscores the necessity of increasing water use efficiency to align with sustainable management standards. Fertilizer application days showed no exceptionally high values. However, variations occurred throughout the 16 days of irrigation. Substrate retention, leaching, or seedling root absorption likely caused these variations. The increase in certain physicochemical parameters is significant. Coconut fiber substrates showed prominent levels of sodium, potassium, EC, and TDS. TDS behavior was notable, increasing by 270% between treatments and over 300% across irrigation days. EC increased by over 260% between treatments and 310% across irrigation days. The pH increased by up to 90% between treatments and over 95% across irrigation days. Sodium increased by over 500% between treatments and 1,800% across irrigation days. Potassium increased by more than 6,000% between treatments and 6,900% across irrigation days. Similarly, calcium increased between 195% and 270%, with peat moss showing the highest values. The most important finding was high NO₃⁻ accumulation in the peat + perlite combination. This posed a significant environmental hazard. Concentrations exceeded the original irrigation of water by 600% to 1,600%. Detected levels of potassium, sodium, and nitrates pose a contamination risk. These levels indicate potential toxicity for agricultural irrigation. Our results highlight the need to monitor leachate dynamics. Leachate monitoring is an important indicator of environmental impact. Substrate management must change to reduce contamination danger. Future studies should focus on large-scale validation and more physicochemical factors. Creating treatment plants and securing leachate reuse are also primary objectives.
Abad, M.; Noguera, P.; Puchades, R.; Maquieira, A. & Noguera, V. (2002). Physicochemical and chemical properties of some coconut coir dust for use as a peat substitute for containerized ornamental plants. Bioresource Technology 82, 241-245.
AENOR. (2022). Norma UNE-EN 13041. Mejoradores de suelo y sustratos de cultivo: Determinación de propiedades físicas. Densidad aparente seca, volumen de aire, volumen de agua, valor de contracción y porosidad total (p. 25). AENOR.
Agrolita de México. (2023). Baja ficha técnica agrolita [Ficha técnica]. Scribd. scrib.com
Aguilar Ibarra, A., & Pérez Espejo, R. H. (2008). La contaminación agrícola del agua en México: Retos y perspectivas. Problemas del Desarrollo, 39(153), 205-215. http://www.scielo.org.mx/scielo.php?script=sci_arttext&pid=S0301-70362008000200009
Alcalá Jáuregui, J. A.; Ramírez Cubos, M. F.; Rojas Velázquez, Á. N.; Diedhiou, I.; Filippini, M. F.; Cónsoli, D.; Martínez Carretero, E.; Rodríguez Ortiz, J. C.; Guillén Castillo, O. I.; Ontivero, M. 2025. Variaciones de las emisiones atmosféricas en la quema por biomasa de especies arbóreas como indicador ambiental. Revista de la Facultad de Ciencias Agrarias. Universidad Nacional de Cuyo. 57(2): 69-86. DOI: https://doi.org/10.48162/rev.39.172
Alcalde-Sanz, L., & Gawlik, B. M. (2017). Minimum quality requirements for water reuse in agricultural irrigation and aquifer recharge: Towards a water reuse regulatory instrument at the EU level. Publications Office of the European Union. https://data.europa.eu/doi/10.2760/887727
Ayers, R. S., & Westcot, D. W. (1994). Water quality for agriculture (Estudio FAO: Riego y Drenaje, Núm. 29). FAO. https://www.fao.org/documents/card/es/c/d5ded352-1815-5718-9797-58e42860a896/
Banjaw, D. T., Megersa, H. G., & Lemma, D. T. (2017). Effect of water quality and deficit irrigation on tomato yield and quality: A review. Advances in Crop Science and Technology, 5(295). https://doi.org/10.4172/2329-8863.1000295
Barbaro, L., Karlanian, M., & Mata, D. (2018). Importancia del pH y la conductividad eléctrica (CE) en los sustratos para plantas. Ediciones INTA.
Berrueta, C., & Grasso, R. (2024). El problema de la acumulación de sodio en suelos bajo invernáculo y cómo manejarlo. INIA, 76, 77-80. https://ainfo.inia.uy/digital/bitstream/item/17547/1/Revista-INIA-76-Marzo-2024-20.pdf
Camacho, O. I. M., Toro, M. C. H., & Díaz, J. S. G. (2021). Caracterización de materiales con uso potencial como sustratos en sistemas de cultivo sin suelo. Ciencia y Tecnología Agropecuaria, 22(1), 1-23. https://doi.org/10.21930/rcta.vol22_num1_art:1977
Centro de Estudios para el Desarrollo Rural Sustentable y la Soberanía Alimentaria (CEDRSSA). (2018). La producción y el comercio del tomate en México. Poder Legislativo, Cámara de Diputados. (p. 13). https://www.cedrssa.gob.mx/files/b/13/86Tomate.pdf
Chartzoulakis, K., & Bertaki, M. (2015). Sustainable water management in agriculture under climate change. Agriculture and Agricultural Science Procedia, 4, 88-98. https://doi.org/10.1016/j.aaspro.2015.03.011
Comisión Nacional del Agua (CONAGUA). (2020). Ley Federal de Derechos de Agua: Disposiciones aplicables en materia de aguas nacionales. https://www.gob.mx/cms/uploads/attachment/file/555838/CGRF-1-20_LFD.pdf
Cortés-Jiménez, J. M., Troyo-Diéguez, E., & Garatuza-Payán, J. (2009). Correlación entre indicadores de la calidad del agua para uso agrícola (Folleto técnico No. 66). INIFAP.
CSR Laboratorio. (2023). Riego V: Interpretación de análisis de agua de riego. https://www.csrlaboratorio.com
CSR Servicios. (2006). Interpretación de análisis de aguas de riego. Laboratorio de análisis agrícolas. https://www.csrservicios.es
De la Cruz-Lázaro, E., Estrada-Botello, M. A., Robledo-Torres, V., Osorio-Osorio, R., Márquez-Hernández, C., & Sánchez-Hernández, R. (2009). Producción de tomate en invernadero con composta y vermicomposta como sustrato. Universidad y Ciencia, 25(1), 59-67. http://www.scielo.org.mx/scielo.php?script=sci_arttext&pid=S0186-29792009000100004
Diaz, B. G., Acuña, A. J., Almonacid, L. R., Gaspari, M. F., Bertinat, M., Bertoni, O., & Peri, P. L. (2025). Water quality assessment of streams and rivers for irrigation in Southern Continental Patagonia. Revista de la Facultad de Ciencias Agrarias. Uncuyo, 57(1), 28-40. https://doi.org/10.48162/rev.39.149
DOF. Diario Oficial de la Federación. (2022). NORMA Oficial Mexicana NOM-127-SSA1-2021, Agua para uso y consumo humano. Límites permisibles de la calidad del agua. DOF - Diario Oficial de la Federación
Durán Altisent, J. M.; Retamal Parra. N. & Moratiel Yugueros, R. (2009). Influencia del pH en los sistemas de cultivo. Regadíos. Agricultura Revista Agropecuaria, 915, 142-145.
Flores, J., Ojeda-Bustamante, W., López, I., Rojano, A., & Salazar, I. (2007). Requerimientos de riego para tomate de invernadero. Terra Latinoamericana, 25(2), 127-134.
Garbanzo-León, G., & Vargas-Gutiérrez, M. (2014). Determinaciones fisicoquímicas de diez mezclas de sustratos para producción de almácigos, Guanacaste, Costa Rica. InterSedes, 15(30),151-168.
Gayosso-Rodríguez, S., Borges-Gómez, L., Villanueva-Couoh, E., Estrada-Botello, M. A., & Garruña, R. (2018). Caracterización física y química de materiales orgánicos para sustratos agrícolas. Agrociencia, 52(4), 639-652. http://www.scielo.org.mx/scielo.php?script=sci_arttext&pid=S1405-31952018000400639&lng=es&tlng=es.
Gonnella, M., & Renna, M. (2021). The Evolution of Soilless Systems towards Ecological Sustainability in the Perspective of a Circular Economy. Is It Really the Opposite of Organic Agriculture? Agronomy, 11(5), 950. https://doi.org/10.3390/agronomy11050950
Gutiérrez-Castorena, M. C., Hernández Escobar, J., Ortiz-Solorio, C. A., Anicua Sánchez, R., & Hernández Lara, M. E. (2011). Relación porosidad-retención de humedad en mezclas de sustratos y su efecto sobre variables respuesta en plántulas de lechuga. Revista Chapingo. Serie Horticultura, 17(3), 183-196. http://www.scielo.org.mx/scielo.php?script=sci_arttext&pid=S1027-152X2011000300010
Kader, S., Gratchev, I., & Michael, R. N. (2024). Recycled waste substrates: A systematic review. The Science of the Total Environment, 953, 176029. https://doi.org/10.1016/j.scitotenv.2024.176029
Kronvang, B., Wendland, F., Kovar, K., & Fraters, D. (2020). Land use and water quality. Water, 12(9), 2412. https://doi.org/10.3390/w12092412
LiTEC. (2025). Ficha técnica turba kekkila DSM 05 [Ficha técnica]. Scribd. https://es.scribd.com/document/739653214/Ficha-Tecnica-Turba-Kekkila-Dsm-05-2-1
Lucero-Sorbazo, D., Beltrán-Villavicencio, M., González-Aragón, A., & Vázquez-Morillas, A. (2022). Recycling of nutrients from landfill leachate: A case study. Heliyon, 8(5), e09540. https://doi.org/10.1016/j.heliyon.2022.e09540
Maraña Santacruz, M. A., Castellanos Pérez, E., Vázquez Vázquez, C., Martínez Ríos, J. J., Trejo Escareño, H. I., Gallegos Robles, M. Á., & Orona Castillo, I. (2018). Rendimiento de chile jalapeño con lixiviado de lombriz con dos métodos de riego. Terra Latinoamericana, 36, 345-354. https://doi.org/10.28940/terra.v36i4.253
Martínez-Florián, P., & Roca, D. (2011). Sustratos para el cultivo sin suelo: Materiales, propiedades y manejo. En V. J. Flórez (Ed.), Sustratos, manejo del clima, automatización y control en sistemas de cultivo sin suelo (pp. 37-78). Editorial Continental.
Mateo-Sagasta, J., Marjani, S. Z., & Turral, H. (2017). Water pollution from agriculture: A global review. Executive summary. Organización de las Naciones Unidas para la Alimentación y la Agricultura (FAO). https://openknowledge.fao.org/handle/20.500.14283/i7754en
Mixquititla-Casbis, G., Villegas-Torres, Ó., Andrade Rodríguez, M., & Sotelo-Nava, H. (2022). Propiedades físicas y químicas de sustratos en función de su granulometría y componente orgánico-mineral. Acta Agrícola y Pecuaria, 8, e0081007. https://doi.org/10.30973/aap/2022.8.0081007
Moxey, A. (2012). Agriculture and water quality: Monetary costs and benefits across OECD countries. Organización para la Cooperación y El Desarrollo Económico. https://www.oecd.org/greengrowth/sustainable-agriculture/49841343.pdf
Norma Oficial Mexicana NOM-127-SSA1-2021, Agua para uso y consumo humano. Límites permisibles de la calidad del agua. (2021). Diario Oficial de la Federación. https://www.dof.gob.mx
Ongley, E. D. (1996). Control of water pollution from agriculture (FAO Irrigation and Drainage Paper No. 55). Organización de las Naciones Unidas para la Alimentación y la Agricultura (FAO). http://www.fao.org/3/w2598E/w2598e00.htm
Organización Mundial de la Salud (OMS). (2006). Guías para la calidad del agua potable: Primer apéndice a la tercera edición. Volumen 1: Recomendaciones. OMS.
Pérez-Díaz, F., Arévalo-Galarza, M. de L., Pérez-Flores, L. J., Lobato-Ortiz, R., & Ramírez-Guzmán, M. E. (2020). Crecimiento y características postcosecha de frutos de genotipos nativos de tomate (Solanum lycopersicum L.). Revista Fitotecnia Mexicana, 43(1), 89-99. https://doi.org/10.35196/rfm.2020.1.89
Programa Regulatorio Agrícola. (2013). Recurso para agricultores para nitratos en el agua potable. Central Coast Regional Water Quality Control Board. https://www.waterboards.ca.gov/centralcoast/water_issues/programs/ag_waivers/index.html
Quesada, G., & Méndez, C. (2005). Análisis fisicoquímico de materias primas y sustratos de uso potencial en almácigos de hortalizas. Agronomía Tropical (CR), 35(1), 1-13.
Rincón, J.; Rincón, P.; Torres, E.; Mondragón, A.; Sánchez, M.; Arana, A.; Jiménez, E. 2016. Caracterización fisicoquímica y funcional de la fibra de mesocarpio de coco (Cocos nucifera L.). Investigación y Desarrollo en Ciencia y Tecnología de Alimentos, 1(2), 279-284.
Rodríguez, S. G., Gómez, L. D. C. B., Couoh, E. V., Estrada, M. A. (2016). Conductividad eléctrica y sales en lavados de fibra de coco y sargazo. Ciencia y Tecnol. Agrop. México, 4(1), 20-26.
Salas S., M. C.; Urrestarazu, M. & Valera, D. (2003). La contaminación por nitratos en los sistemas agrícolas. Vida Rural, 40, 38-40.
Sarabia-Meléndez, I. F., Cisneros Almazán, R., Aceves de Alba, J., Durán García, H. M., & Castro Larragoittia, J. (2011). Calidad del agua de riego en suelos agrícolas y cultivos del Valle de San Luis Potosí, México. Revista Internacional de Contaminación Ambiental, 27(2), 103-113. https://www.scielo.org.mx/scielo.php?script=sci_arttext&pid=S0188-49992011000200002
Secretaría de Desarrollo Agropecuario y Recursos Hidráulicos (SEDARH). (2025). Tomate rojo (jitomate). Sistema Estatal de Información Agropecuaria. https://sedarh.gob.mx/seia/cultivos/tomaterojo
Servicio de Información Agroalimentaria y Pesquera (SIAP). (2022). Panorama agroalimentario 2022. Secretaría de Agricultura y Desarrollo Rural. https://www.gob.mx/cms/uploads/attachment/file/688688/Panorama_Agroalimentario_2022.pdf
Shanmugavel, D., Rusyn, I., Solorza-Feria, O., & Kamaraj, S. K. (2023). Sustainable SMART fertilizers in agriculture systems: A review on fundamentals to in-field applications. Science of The Total Environment, 904, 166729.
Thorne, D. W., & Peterson, H. B. (1996). Técnica de riego, fertilidad y explotación de los suelos. Editorial Continental.
Tuxun, A., Xiang, Y., Shao, Y., Son, J. E., Yamada, M., Yamada, S., Tagawa, K., Baiyin, B., & Yang, Q. (2025). Soilless Cultivation: Precise Nutrient Provision and Growth Environment Regulation Under Different Substrates. Plants, 14(14), 2203. https://doi.org/10.3390/plants14142203
United Nations Educational, Scientific and Cultural Organization (UNESCO). (2025). The United Nations World Water Development Report 2025: Mountains and glaciers - Water towers. https://www.unesco.org/reports/wwdr/en/2025
Valdés, A. E. (2015). Contenido de nitratos en lechuga (Lactuca sativa L.) cultivada en la 3.ª Zona de Riego del Río Mendoza (Tesina de grado, Universidad Nacional de Cuyo). Biblioteca Digital. https://bdigital.uncu.edu.ar/6681
Valles-Aragón, M., Ojeda-Barrios, D., Guerrero-Prieto, V., Prieto-Amparan, J., & Sánchez-Chávez, E. (2017). Calidad del agua para riego en una zona nogalera del estado de Chihuahua. Revista Internacional de Contaminación Ambiental, 33(1), 85-97. https://doi.org/10.20937/RICA.2017.33.01.08
Wahb-Allah, M. A., & Al-Omran, A. M. (2012). Effect of water quality and deficit irrigation on tomato growth, yield and water use efficiency at different developmental stages. Journal of Agricultural and Environmental Sciences, 11(2), 1-10.
Yadav, S. C. (2024). Water Pollution: The Problems and Solutions. Science Insights, 44(2), 1245-1251. https://doi.org/10.15354/si.24.re905
Yescas-Coronado, P., Segura-Castruita, M. A., Orozco-Vidal, J. A., Enríquez-Sánchez, M., Sánchez-Sandoval, J. L., Frías-Ramírez, J. E., Montemayor-Trejo, J. A., & Preciado-Rangel, P. (2011). Uso de diferentes sustratos y frecuencias de riego para disminuir lixiviados en la producción de tomate. Terra Latinoamericana, 29(4), 441-448. https://www.scielo.org.mx/scielo.php?script=sci_arttext&pid=S0187-57792011000400441%20