Rev. FCA UNCuyo | 2026 | 58(1) | ISSN 1853-8665
Natural resources and environment
https://doi.org/10.48162/rev.39.215
Integrating Professional and Crowdsourced Data to Address Biodiversity Knowledge Gaps in Under-Sampled Semi-Arid Wetlands
Integración de datos profesionales y colaborativos para abordar vacíos de conocimiento sobre biodiversidad en humedales semiáridos
Joaquin Asad 1
Ever Tallei 1
Benjamin Bender 1
Bertilde Rossi 1
1 Instituto Argentino de Investigaciones de las Zonas Áridas (IADIZA). CCT-CONICET Mendoza, UNCuyo. Gobierno de Mendoza. Av. A. Ruiz Leal s/n. Parque General San Martín. C. P. 5500. Mendoza. Argentina.
* stabeni@mendoza-conicet.gob.ar
Abstract
Arid wetlands are vulnerable ecosystems affected by natural and human factors. Their study and conservation are limited by data scarcity and sampling bias. In a wetland of west-central Mendoza, Argentina (Leyes-Tulumaya streams), we explored the contribution of plant and vertebrate records from traditional scientific sources and citizen science. Of 270 recorded species, citizen science contributed the majority of records and unique species. Similarity between databases was greatest between citizen science and literature, with birds dominating among vertebrates. The vertebrate inventory stabilized over time, although estimated richness exceeded observed richness. Accumulation curves for plants did not reach asymptote, suggesting incomplete sampling. Positive spatial autocorrelation of records was detected, indicating data clustering in lagoons. The integration and joint analysis of data sources proved crucial to obtain a more complete and robust understanding of biodiversity and its spatial distribution. Citizen science contributions, in particular, expand databases in understudied arid ecosystems, complementing traditional methods and addressing spatial and temporal information gaps.
Keywords: Monte Desert wetlands, scientific collections, citizen science, biodiversity monitoring
Resumen
Los humedales áridos son ecosistemas vulnerables, afectados por factores naturales y humanos. Su estudio y conservación se ven limitados por la escasez de datos y sesgos de muestreo. En un humedal del centro-oeste de Mendoza, Argentina (Arroyos Leyes-Tulumaya), exploramos la contribución de registros de plantas y vertebrados provenientes de fuentes científicas tradicionales y ciencia ciudadana. De 270 especies registradas, la ciencia ciudadana aportó la mayoría de los registros y especies únicas. La similitud entre bases fue mayor entre ciencia ciudadana y literatura, con aves dominando los vertebrados. El inventario de vertebrados se estabilizó con tiempo, aunque la riqueza estimada superó la observada. Las curvas de acumulación para plantas no alcanzaron una asíntota, sugiriendo un muestreo incompleto. Se detectó autocorrelación espacial positiva de los registros, indicando agrupamiento de datos en las lagunas. La integración y análisis conjunto de fuentes de datos demostró ser crucial para obtener una comprensión más completa y robusta de la biodiversidad y su distribución espacial. Los aportes de la ciencia ciudadana, en particular, expanden las bases de datos en ecosistemas áridos poco estudiados, complementando métodos tradicionales y abordando brechas de información espacial y temporal.
Palabras clave: humedales del Desierto del Monte, colecciones científicas, ciencia ciudadana, monitoreo de biodiversidad
Originales: Recepción: 20/08/2025 - Aceptación: 20/03/2026
Introduction
Preserving biodiversity in arid regions poses challenges for the scientific community. It requires collaboration across scientific fields and innovative technologies. Partnerships with various societal sectors are also necessary. A major hurdle in studying biological diversity in dry regions is the scarcity of data and the challenges in acquiring it Hochachka et al. (2012). Ecological knowledge requires information on species distributions at different scales. However, collecting data at several scales is often costly yet essential for providing a broader context for more focused research and conservation efforts Reis et al. (2016). Few arid regions have sampling levels proportional to their diversity Wolf et al. (2022). In a scenario of accelerated expansion of agriculture, urbanization, and fragmentation, acquiring additional data is crucial to rectify environmental representation biases. This helps assess species loss and their ecological roles García-Vega & Newbold (2020).
Crowdsourced data play a significant role in biodiversity monitoring Bowler et al. (2022), Gouraguine et al. (2019). Citizen science involves the public in research, allowing non-scientists to help collect and analyze data. This approach aids biological information gathering across large areas Wolf et al. (2022). On the other hand, long-term ecosystem data demand funding commitments that is not always assured, impacting conservation endeavors. Citizen science data expands biodiversity databases, complementing professional data in ecosystems Galván et al. (2022), Klemann-Junior (2017).
South American arid wetlands are unexplored and undersampled ecosystems Reis et al. (2016). These ecosystems have high levels of use but little biological information. Wetlands are vital in dry regions because they provide essential surface and groundwater for communities and wildlife Pocock (2017). This study explores biodiversity data from traditional scientific methods and data arising from citizen participation strategies. We aim to: 1) compare records from different sources (i.e. scientific collections, literature, and citizen science observations), to analyze biodiversity knowledge; 2) analyze temporal data acquisition to assess quality and gaps; 3) explore spatial distribution of data to assess the geographical scope. We hypothesize that 1) citizen science data complement and expand traditional scientific data, 2) combining data sources reduces spatial biases, resulting in a pattern of observed richness characterized by well-sampled and undersampled areas.
Materials and Methods
Study Area
The study area encompasses the wetland system of the Leyes-Tulumaya streams. It consists of seasonal lagoons and marshes, and riparian habitats (-32.763° S -68.594° W) (figure 1).
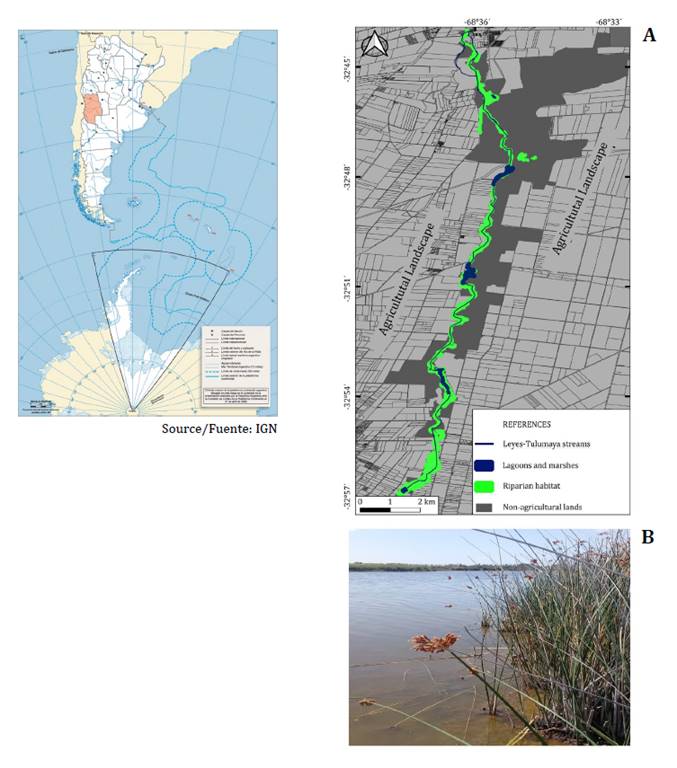
Figure 1. A. Map of study area. Wetland system of the Leyes-Tulumaya streams (Mendoza, Argentina). B. Riparian habitat and lagoon in a section of the Leyes-Tulumaya streams.
Figura 1. A. Mapa del área de estudio. Humedal de los arroyos Leyes-Tulumaya (Mendoza, Argentina). B. Hábitat ripario y laguna en una sección de los arroyos Leyes-Tulumaya.
The system is in the Mendoza River Basin within the Monte Desert biome (Mendoza). This system receives subsurface water from the Mendoza River, along with surface runoff from rain and drainage from irrigated farms and agricultural drainage. The wetland is part of the Gran Ciénaga del Bermejo. Its surface has been gradually decreasing since colonial times due to agricultural and urban expansion Prieto et al. (2012), Ciardullo et al. (2025). The wetland sits in a mosaic of urban and agricultural landscapes. Riparian habitats feature dense formations of Scirpus californicus, Typha dominguensis and Phragmites australis. Flooded habitats include Salicornia sp., Distichlis sp., Juncus spp., Xanthium sp. and Suaeda sp. Contreras & Fernandez (1980).
Data Source
We used plant and vertebrate occurrence data, the most recorded groups, to compare data from expert sampling and citizen science. We conducted bibliographic searches in Google Scholar until December 2024. The search used terms such as: Leyes Tulumaya AND wetland* OR humedal OR humedales OR sistema OR laguna*. This identified 21 articles. We chose peer-reviewed articles from scientific journals that featured these words in titles, abstracts, or keyword lists: We excluded technical reports and theses to ensure reproducibility. We expanded the search at the documentation center of the CONICET (Consejo Nacional de Investigaciones Científicas y Técnicas). After filtering and integrating both searches, we obtained 12 articles concerning wetland biodiversity.
We reviewed the scientific collections of IADIZA CONICET Mendoza. Plant records came from the herbarium collection (MERL, Mendoza Ruiz Leal). Vertebrates came from the collections of birds (CORI), mammals (CMAI), reptiles and amphibians (CHEI) and fishes (CICI). The revision covered years 1933 in plants and 1976 in vertebrates, to December 2024. We also searched non-digitized records in field notebooks of naturalists and collectors and the accession register of specimens. We obtained 38 plant and 150 vertebrate species records. For specimens lacking geographic coordinate data, the text on the label or collection card was manually inspected. Once the locality was obtained, the georeferencing protocol proposed by Zermoglio et al. (2020) was applied. The crowdsourced biodiversity data came from the citizen science platforms iNaturalist https://www.inaturalist.org/ and eBird https://ebird.org/home. As this wetland lacks a conservation status, its boundaries are not well defined. In order to create a polygon that encompasses all citizen-reported observations, we calculated the maximum habitat reach influenced by water in non-agricultural lands: We calculated the maximum water reach in non-agricultural lands between 1985 and 2022, in QGIS version 3.26 (figure 1). We used MapBiomas Argentina Collection 1 for land cover classifications (https://argentina.mapbiomas.org/). The polygon includes streams, lagoons, and marshes and riparian habitats. We selected iNaturalist observations of plants and vertebrate species with a research grade designation, meaning their taxonomic identification had at least two-thirds expert agreement. This search resulted in 458 species records. In addition to the iNaturalist database, we consult the eBird database. We filtered the eBird list of bird species occurring in the study area, resulting in 5450 records. We extracted scientific names, dates, and coordinates.. We manually reviewed photographs to rule out taxonomic errors. To ensure comparability across different sources, taxonomic nomenclature, was revised and aligned with GBIF (Troudet et al., 2017) standards. Additionally other reference bases such as Sociedad Argentina para el Estudio de los Mamíferos https://www.sarem.org.ar/ and Flora Argentina http://www.floraargentina.edu.ar/ were consulted. Species whose geographic range did not align with the study area were excluded, along with duplicate records. Records of species with doubtful or debated taxonomy were considered only at the genus level.
Data Analysis
We compared species composition similarity across data sources Jaccard index-based similarity matrices were used to generate dendrograms (single linkage) visualizing data source relationships. We performed clustering analysis using PAST 4.0. To test for taxonomic differences within and between datasets a we conducted a X² test. We integrated records to provide a first quantitative assessment of species richness and analyze the completeness of the inventory. Species records from three data sources were integrated from the first record until December 1st, 2024. Data were grouped into 3-year periods. This resuled in 17 periods for vertebrates (1977-2024) and 15 for plants (1980-2024). We calculated species accumulation curves using the nonparametric estimators CHAO 2 and ICE Callaghan et al. (2021) using EstimateS 9.1.0 Colwell & Elsensohn (2014). We tested spatial autocorrelation of biodiversity records using Moran’s I statistic. This index ranges from -1 to 1. High and positive values of Moran’s I indicate positive autocorrelation, implying the clustering of similar values. A value close to zero indicates no autocorrelation. Moran’s I was computed in GeoDa 0.9 (Anselin et al., 2009).
Results
The three datasets yielded 270 species of plants and vertebrates. Plants represented 15% and vertebrates 85% being vertebrates. Native species predominate, with only 3% being introduced (3 plant species and 6 vertebrate species). Among plants, Caryophyllales (27%) and Asterales (22%) were most abundant. Passeriformes (60%) and Charadriiformes (12%) dominated bird records. Rodentia (75%) and Carnivora (25%) prevailed in mammals. Amphibians and reptiles included Anura and Squamata. Siluriformes (33%) and Characiformes (22%) were the most frequent orders in fishes. Database similarity ranged from 0.21 to 0.66. Citizen science and literature databases showed the greatest similarity, indicating a greater number of shared species, primarily birds (57%) (figure 2).
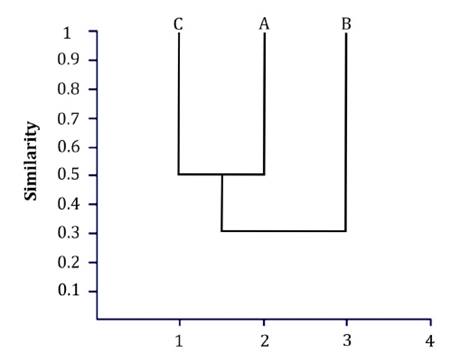
A: scientific literature; B: biological collections; C: citizen science from the Leyes and Tulumaya streams wetland system (Mendoza, Argentina).
A: literatura científica; B: colecciones biológicas; C: ciencia ciudadana del sistema de humedales de los arroyos Leyes y Tulumaya (Mendoza, Argentina).
Figure 2. Similarity dendrogram (Jaccard index) between species databases from the Leyes and Tulumaya streams wetland system (Mendoza, Argentina).
Figura 2. Dendograma de similitud (índice de Jaccard) entre bases de datos de especies del sistema de humedales de los arroyos Leyes y Tulumaya (Mendoza, Argentina).
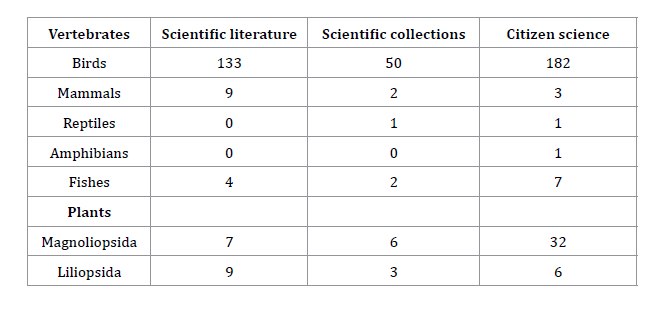
Citizen science data yielded the most records (232 species of vertebrates and plants). It also had the highest number of unique species. Since 2009, it contributed 72 unique vertebrates and 21 unique plants. Literature added 162 records since 1980, including 24 unique vertebrates and 3 unique plant species. Scientific collections contributed 64 species since 1976, including only 8 unique vertebrate records. Vertebrate representation did not differ significantly across databases (X² = 8.96, df = 8, p = 0.34). Birds comprised 92% of vertebrate records. This differed significantly from other clases (X² = 1296.08, df = 4, p < 0.001). Plant records, differed between databases. Magnoliopsida (dicotyledons) was prevalent in citizen science records (X² = 9.15, df = 2, p < 0.05). It was more abundant than Liliopsida (monocotyledons) (X² = 11.57, df = 1, p < 0.001) (table 1).
Table 1. Number of records of plants and vertebrates species from the Leyes and Tulumaya streams wetland system reported in the different databases.
Tabla 1. Número de registros de especies de plantas y vertebrados en el sistema de humedales de los arroyos Leyes y Tulumaya según diversas bases de datos.
Since the first record of vertebrate species in the wetland (1976), the completeness of the inventory has evolved, as seen in the species accumulation curve (figure 3 A).
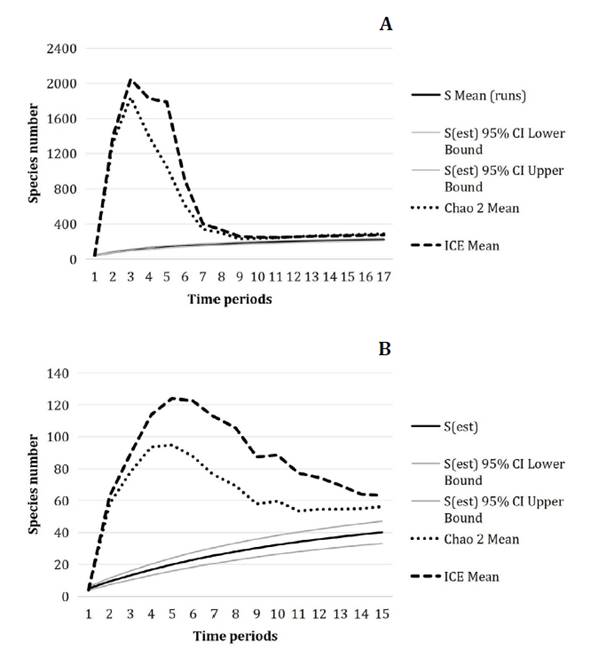
Estimated richness (S est) and confidence intervals and richness according to non-parametric estimators CHAO 2 and ICE over time.
Riqueza estimada (S est) con intervalos de confianza y riqueza según estimadores no paramétricos CHAO 2 e ICE a lo largo del tiempo.
Figure 3. Species accumulation curve for vertebrates (A) and plants (B) in the wetland system of the Leyes and Tulumaya streams.
Figura 3. Curva de acumulación de especies de vertebrados (A) y plantas (B) en el sistema de humedales de los arroyos Leyes y Tulumaya.
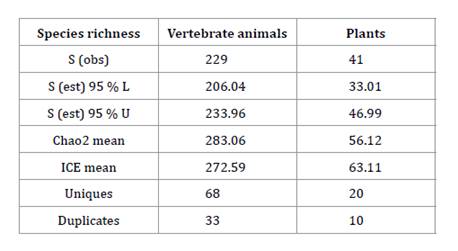
The vertebrate inventory has evolved since 1976. The non-parametric estimators ICE and Chao2 (Challaghan et al., 2021) show growth in initial stages (1976-1988), followed by a stabilization. The high number of uniques in this period suggests that literature and collections were the main sources of new species (table 2).
Table 2. Richness of vertebrate animals and plants observed in the Leyes and Tulumaya streams wetland system (S obs) and its upper (S (est) U) and lower (S (est) L) 95% confidence intervals, and estimated through the Chao2 and ICE indices.
Tabla 2. Riqueza de animales vertebrados y de plantas observadas en el sistema de humedales de los arroyos Leyes y Tulumaya (S obs) y sus intervalos superior (S (est) U) e inferior (S (est) L) del 95 % de confianza y estimada a través de los índices de Chao2 e ICE.
The number of unique and duplicated species in the database consisted of scientific collections, literature, and citizen science.
El número de especies únicas y duplicadas en la base de datos está compuesto por colecciones científicas, literatura y ciencia ciudadana.
Uniques decreased after the 2000s. This indicates diversity is approaching the asymptote. Although the decrease in uniqueness at the end of the curve suggests adequate detection of diversity, the estimated richness (ICE: 272 species, Chao2: 283 species) exceeds the observed richness (229 species). Suggesting that a dditional species may still be found. Observed plant species richness was 41. Nonparametric estimators suggested higher richness than observed. ICE values exceeded Chao2, but species accumulation curves for both exhibited high initial growth without reaching a clear asymptote (figure 3 B). The increasing average of unique species suggests incomplete sampling (table 2). The local Moran’s I statistic revealed positive spatial autocorrelation in the data distribution (Moran’s I = 0.856, p < 0.05). This result indicates a marked tendency for similar values to cluster among neighboring sites. Sites with a higher records are geographically adjacent to other sites with high records, predominantly located in the upper-right quadrant (High-High) (figure 4 A).
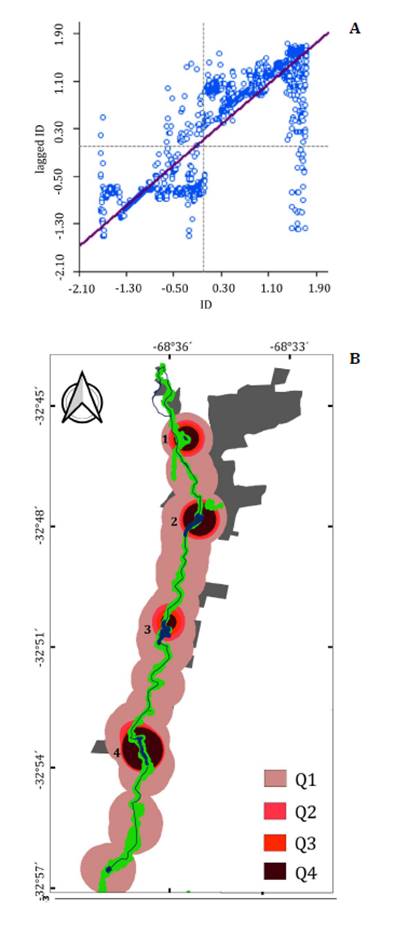
(A) The spatial distribution of vertebrate and plant records (B) in the wetland system of the Leyes and Tulumaya streams (Mendoza, Argentina). Occurrence records are presented cumulatively in quartiles (Q1 = 100%, Q2 = 75%, Q3 = 50%, Q4 = 25%). Montenegro lagoon (1), Soria lagoon (2), La Paloma lagoon (3), Viborón lagoon (4).
(A) Distribución espacial de los registros de vertebrados y plantas (B) en el sistema de humedales de los arroyos Leyes y Tulumaya (Mendoza, Argentina). Los registros de ocurrencia se presentan acumulados en cuartiles (Q1= 100 %, Q2=75%, Q3=50%, Q4=25 %). Laguna Montenegro (1), Laguna de Soria (2), Laguna de La Paloma (3), Laguna del Viborón (4).
Figure 4. Moran scatter plot showing the spatial autocorrelation of species records.
Figura 4. Diagrama de dispersión de Moran mostrando la autocorrelación espacial de los registros de especies.
Analogously, sites with lower values of species records also cluster spatially, concentrating in the lower-left quadrant (Low-Low). The distribution of species records was not random within the wetland but rather exhibits a distinctive pattern of spatial clustering. Records were higher in the wetland’s lagoons (from north to south: Montenegro lagoon, Soria lagoon, La Paloma lagoon, and Viborón lagoon), while areas connecting the lagoons had fewer records (figure 4 B).
Discussion
Comprehensive biodiversity inventories are crucial alongside conservation efforts. Many species vanish before they can be documented (Freitas & Gouveia, 2025). As expected in hypothesis 1, the results show increasing data from citizen scientists since the 2000s, contrasting with professional databases’ peak in the 1970s-80s. A growing number of studies have yielded results consistent with our results, showing that in the last two to three decades, the global increase in data from citizen science platforms had become established as a valuable and effective resource for filling information gaps about biodiversity (Mason et al., 2025; Pocock et al., 2017). Citizen science however does not replace systematic records or professional biological collections. Collections ensure standardized methods, taxonomic accuracy, long-term accessibility, and detailed contextual data (Suarez & Tsutsui, 2004).
Citizen contributions often focus on charismatic groups. Birds are well-represented because they are easily observed Rodriguez et al., 2024. Our results also showed a predominance of bird records, contributed mainly in eBird and iNaturalist. We found no significant variation between citizen and professional databases. This suggests a natural abundance of birds for this desert wetland. Various studies indicate that opportunistic citizen science data exhibit uneven sampling over time and a bias towards charismatic taxa. Our results confirm this situation and highlight the need to implement strategies to mitigate data loss in future research. The adoption of standardized sampling protocols (Hochachka et al., 2012), the education and training of participants in the identification of less conspicuous taxa (Bonney et al., 2014), and the implementation of incentives to record underrepresented groups (Theobald et al., 2015) would consolidate the existing database. In addition to the rapid accumulation of data, taxonomic bias is further exacerbated over time. Species identification from photographs, has limits by the impossibility of observing key taxonomic traits. Species-level identification in groups like small mammals, fish, or plants necessitates analysis of physical specimens. While citizen science offers new possibilities, data quality and identification challenges, reinforce the importance of expert validation and systematic collection of data (Miller & Edwards, 2016). Thus, presence of cryptic species (e.g., Astyanax spp. (Pisces)) or species detectable only through specific capture techniques (e.g., small rodents) in our study site, exemplifies the need for professional sampling and to expand scientific collections by adding more specimens.
In accordance with hypothesis 2, the spatial distribution of data exhibits distinctive patterns, reflecting the spatial heterogeneity of species records. Citizen science data often concentrate in accesible areas. This leaves gaps in remote or less-explored regions (Callaghan et al., 2021). In turn, scientific collections and research projects can also reflect historical sampling biases, leading to uneven coverage resulting in geographical and taxonomic gaps, especially for less-studied regions or groups (Daru et al., 2018). Our study revealed data clusters in four lagoon-riparian habitats and a lower number of records in the areas that connect them. Our results suggest that biodiversity hotspots reflect sampling effort rather than necessarily representing areas of greater species diversity. Skewed distribution we detected in records, as an indirect indicator of wetland accessibility, would allow these data to be used to investigate the consequences of advancing land use and habitat fragmentation that threaten species mobility in wetlands (Amezaga et al., 2002). The lack of access and private ownership of the spaces that connect the lagoons and their riparian habitats could be a limiting factor resulting in the scarcity of records from citizen and research sources and would require consideration in future monitoring. Furthermore, providing spatially explicit data on species distribution in data-poor or data-free regions can greatly assist decision-makers in directing resources to priority research areas (Herrera-Lopera et al., 2025). The lack of knowledge about the world’s arid zone wetlands does not reflect their conservation importance. These key biodiversity areas support vulnerable populations and should be preserved due to their ecological significance and integrity (van Rees et al., 2025). For example, the diversity of the bird group surveyed in our study from professional and non-professional sources reveals heterogeneity in the use of the wetland’s temporal and spatial resources. This aspect has been pointed out by other previous studies that have highlighted the function of this wetland as refuge, nesting sites for migrants, and biological corridors to high-productivity areas (Tallei et al., 2021).
The complementarity of professional and non-professional databases allows for the completion of species lists in the face of the urgent need for knowledge demanded by the management of wetlands in dry regions. As Callaghan et al. (2021) points out, redundancies and gaps in citizen science data (taxonomic, spatial, and temporal biases) also exist in professional scientific data. Our results demonstrate that the scarcity of data in certain taxonomic groups has not been covered by either citizen science or professionals, as is the case with underrepresented groups such as fish, amphibians, mammals, and, surprisingly, plants. Far from being an isolated case, our case study aligns with the patterns observed in global biodiversity databases, such as GBIF (Troudet et al., 2017), as well as particularly in desert wetlands, where, for example, 60.4% of the freshwater taxa described are insects, while small mammals are largely ignored in biodiversity monitoring programs (Stephenson et al., 2020).
Integrating academic and citizen science data offers the most accurate approach to understanding biodiversity by offsetting inherent biases (Díaz-Calafat et al., 2024). While these data sources are largely independent operationally, citizen science observations are conceptually dependent on academic data through shared taxonomic frameworks, nomenclature, and species concepts developed by professional taxonomists. Acknowledging this linkage is essential for interpreting differences between datasets, as observed discrepancies reflect not only contrasting sampling strategies but also their integration within a common taxonomic foundation (Chandler et al., 2017).Therefore, the conservation of freshwater ecosystems requires collaborative strategies between experts and citizens to expedite data collection, incorporate it into public databases to prioritize the conservation of their invaluable biodiversity and contribute to ecosystem stability under extreme conditions.
Conclusions
The results obtained in the present study support the recognition of the Leyes-Tulumaya streams wetland system as an area of significant importance for conservation. The high biodiversity documented in these habitats, immersed in an arid ecosystem, suggests considerable potential for the identification of taxa not yet recorded. Furthermore, it is evident that the contributions derived from citizen science initiatives constitute an invaluable tool for expanding the information available in understudied arid ecosystems, by complementing conventional research methods and addressing data deficits at both spatial and temporal levels. The information generated by this study provides an important basis for the development of management actions aimed at conserving the biodiversity of these wetlands.
Acknowledgements
This work was financed with funds from CONICET Argentina (PIP 2022-2024 00318CO).
Amezaga, J. M., Santamaría, L. & Green, A. J. (2002). Biotic wetland connectivity-supporting a new approach for wetland policy. Acta Oecologica, 23(3), 213-222. https://doi.org/10.1016/S1146-609X(02)01152-9
Anselin, L., Syabri, I., & Kho, Y. (2009). GeoDa: an introduction to spatial data analysis. In Handbook of applied spatial analysis: Software tools, methods and applications. Springer. 73-89.
Bonney, R., Shirk, J. L., Phillips, T. B., Wiggins, A., Ballard, H. L., Miller-Rushing, A. J., Parrish, J. K. (2014). Next steps for citizen science. Science, 343(6178), 1436-1437. https://doi.org/10.1126/science.1251554
Bowler, D. E., Bhandari, N., Repke, L., Beuthner, C., Callaghan, C. T., Eichenberg, D., Henle, K., Klenke, R., Ritcher, A., Jansen, F., Bruelheide, H. & Bonn, A. (2022). Decision-making of citizen scientists when recording species observations. Scientific reports, 12(1), 11069. https://doi.org/10.1038/s41598-022-15218-2
Callaghan, C. T., Poore, A. G., Mesaglio, T., Moles, A. T., Nakagawa, S., Roberts, C., Rowley, J., Vergés, A., Wilshire, J. H., Cornwell, W. K. (2021). Three frontiers for the future of biodiversity research using citizen science data. BioScience, 71(1), 55-63. https://doi.org/10.1093/biosci/biaa131
Chandler, M., See, L., Copas, K., Bonde, A. M., López, B. C., Danielsen, F., Legind, J. K., Masinde, S., Miller-Rushing, A. J., Newman, G., Rosemartin, A., Turak, E. (2017). Contribution of citizen science towards international biodiversity monitoring. Biological Conservation, 213, 280-294. https://doi.org/10.1016/j.biocon.2016.09.004
Ciardullo, F. V, & Gennari, A. J. (2025). Agricultural Land Valuation-Hedonic Pricing and Geostatistical Advances: A State-of-the-Art Review. Revista de la Facultad de Ciencias Agrarias. Universidad Nacional de Cuyo. 57(2): 224-236. DOI: https://doi.org/10.48162/rev.39.185
Colwell, R. K., & Elsensohn, J. E. (2014). EstimateS turns 20: Statistical estimation of species richness and shared species from samples, with non‐parametric extrapolation. Ecography, 37(6), 609-613. https://doi.org/10.1111/ecog.00814
Contreras, J. R., & Fernandez, A. (1980). Ecología de la avifauna de la laguna del Viborón, Departamento Maipú, Provincia de Mendoza. Revista del Museo de Historia Natural de San Rafael, 8, 3-14.
Daru, B. H., Park, D. S., Primack, R. B., Willis, C. G., Barrington, D. S., Whitfeld, T. J, Seidler, T. G., Sweeney, P. W., Foster, D. R., Ellison, A. M., Davis, C. C. (2018). Widespread sampling biases in herbaria revealed from large‐scale digitization. New Phytologist, 217(2), 939-955. https://doi.org/10.1111/nph.14855
Díaz-Calafat, J., Jaume-Ramis, S., Soacha, K., Álvarez, A., & Piera, J. (2024). Revealing biases in insect observations: A comparative analysis between academic and citizen science data. Plos one, 19: e0305757. https://doi.org/10.1371/journal.pone.0305757eBird. 2021.
eBird: An online database of bird distribution and abundance [web application]. eBird, Cornell Lab of Ornithology, Ithaca, New York. Available: http://www.ebird.org.
Flora Argentina. Flora vascular de la República Argentina y del Cono Sur. http://www.floraargentina.edu.ar/
Freitas, H., & Gouveia, A. C. (2025). Biodiversity futures: Digital approaches to knowledge and conservation of biological diversity. Web Ecology, 25(1), 29-37. https://doi.org/10.5194/we-25-29-2025
Galván, S., Barrientos, R., & Varela, S. (2022). No bird database is perfect: citizen science and profesional datasets contain different and complementary biodiversity information. Ardeola, 69(1), 97-114. https://doi.org/10.13157/arla.69.1.2022.ra6
García-Vega, D., & Newbold, T. (2020). Assessing the effects of land use on biodiversity in the world’s drylands and Mediterranean environments. Biodiversity and Conservation, 29(2), 393-408. https://doi.org/10.1007/s1053
Gouraguine, A., Moranta, J., Ruiz-Frau, A., Hinz, H., Reñones, O., Ferse, S. C., Jompa, J., & Smith, D. J. (2019). Citizen science in data and resource-limited areas: A tool to detect long-term ecosystem changes. PLoS One, 14: e0210007. https://doi.org/10.1371/journal.pone.0210007
Herrera‐Lopera, J. M., Solé, M., & Cultid‐Medina, C. A. (2025). Mapping the Missing: Assessing Amphibian Sampling Completeness and Overlap With Global Protected Areas. Ecology and Evolution, 15: e71137. https://doi.org/10.1002/ece3.71137
Hochachka, W. M., Fink, D., Hutchinson, R. A., Sheldon, D., Wong, W. K., & Kelling, S. (2012). Dataintensive science applied to broad-scale citizen science. Trends in Ecology & Evolution, 27(2), 130-137. https://doi:10.1016/j.tree.2011.11.006
iNaturalist. 2025. iNaturalist observations. https://www.inaturalist.org/observations
Klemann-Junior, L., Villegas Vallejos, M. A., Scherer-Neto, P., & Vitule, J. R. S. (2017). Traditional scientific data vs. uncoordinated citizen science effort: A review of the current status and comparison of data on avifauna in Southern Brazil. PloS one, 12: e0188819. https://doi.org/10.1371/journal.pone.0188819
MapBiomas Argentina - Colección 2 de la Serie anual de Mapas de Cobertura y Uso del Suelo de Argentina, https://argentina.mapbiomas.org/
Mason, B. M., Mesaglio, T., Heitmann, J. B., Chandler, M., Chowdhury, S., Gorta, S. B. J., Grattarola, F., Groom, Q., Hitchcock, C., Hoskins, L., Lowe, S. K., Marquis, M., Pernat, N., Shirey, V., Baasanmunkh, S., & Callaghan, C. T. (2025). iNaturalist accelerates biodiversity research. BioScience, 75(11), 953-965. https://doi.org/10.1093/biosci/biaf104
Miller, S. E., & Edwards, S. E. (2016). Citizen Science and Entomology: An Introduction to New Possibilities and Old Challenges. Annals of the Entomological Society of America, 109, 629-633.
Milton, S. J., & Dean, W. R. J. (2010). Plant invasions in arid areas: Special problems and solutions: a South African perspective. Biological Invasions, 12(12), 3935-3948. https://doi:10.1007/s10530-010-9820-x
Pocock, M. J., Tweddle, J. C., Savage, J., Robinson, L. D., & Roy, H. E. (2017). The diversity and evolution of ecological and environmental citizen science. PloS one, 12(4), e0172579. https://doi.org/10.1371/journal.pone.0172579
Prieto, M. D. R., Rojas, J. F., Castrillejo, T. N., & Hernández, F. (2012). Procesos ambientales y construcción del territorio a partir de un estudio de caso: la ciénaga del Bermejo, oasis Norte de Mendoza 1810-1930. Revista de Historia Americana y Argentina, 47, 175-207.
Reis, R. E., Albert, J. S., Di Dario, F., Mincarone, M. M., Petry, P., & Rocha, L. A. (2016). Fish biodiversity and conservation in South America. Journal of Fish Biology, 89(1), 12-47. https://doi:10.1111/jfb.13016
Rodriguez Forti, L., Passetti, A., Oliveira, T., Lima, J., Queiros, A., Lopes, M. A. D. F., & Szabo, J. K. (2024). Declining representation of imperiled Atlantic Forest birds in community-science datasets. Perspectives in Ecology and Conservation, 22(3), 277-287. https://doi.org/10.1016/j.pecon.2024.02.001
SAREM. Sociedad Argentina para el Estudio de los Mamíferos. https://www.sarem.org.ar/es/lista-demamiferos-de-argentina-2024/
Stephenson, P. J., Ntiamoa-Baidu, Y., & Simaika, J. P. (2020). The use of traditional and modern tolos for monitoring wetlands biodiversity in Africa: Challenges and opportunities. Frontiers in Environmental Science, 8, 61. https://doi.org/10.3389/fenvs.2020.00061
Suarez, A. V., & Tsutsui, N. D. (2004). The value of museum collections for research and society. BioScience, 54(1), 66-74. https://doi.org/10.1641/0006-3568(2004)054[0066:TVOMCF]2.0.CO;2
Tallei, E., Benavidez, A., Schaaf, A., Isola, P., & Zanotti, M. (2021). Seasonal dynamics of waterbirds from a relict wetland in the central Monte Desert, Argentina. Neotropical Biology and Conservation, 16(2), 333-349. https://doi:10.3897/neotropical.16.e61672
Theobald, E. J., Ettinger, A. K., Burgess, H. K., DeBey, L. B., Schmidt, N. R., Froehlich, H. E., Wagner, C., HilleRisLambers, J., Tewksbury, J., Harsch, M. A., Parrish, J. K. (2015). Global change and local solutions: Tapping the unrealized potential of citizen science for biodiversity research. Biological Conservation, 181, 236-2. https://doi.org/10.1016/j.biocon.2014.10.021
Troudet, J., Grandcolas, P., Blin, A., Vignes-Lebbe, R., & Legendre, F. (2017). Taxonomic bias in biodiversity data and societal preferences. Scientific reports, 7(1), 9132. https://doi.org/10.1038/s41598-017-09084-6
van Rees, C. B., Geist, J., & Arthington, A. H. (2025). Grasping at water: a gap‐oriented approach to bridging shortfalls in freshwater biodiversity conservation. Biological Reviews, 100(5), 1970-1991. https://doi.org/10.1111/brv.70030
Wolf, S., Mahecha, M. D., Sabatini, F. M., Wirth, C., Bruelheide, H., Kattge, J., Moreno, A., Martínez, K. M., & Kattenborn, T. (2022). Citizen science plant observations encode global trait patterns. Nature ecology & evolution, 6(12), 1850-1859. https://doi.org/10.1038/s41559-022-01904-x
Zermoglio, P. F., Chapman, A. D., Wieczorek, J. R., Luna, M. C., Bloom, D. A. (2020). Georeferencing Quick Reference Guide. Copenhagen: GBIF Secretariat. https://doi.org/10.35035/e09p-h128