
Parameterization of the Hargreaves equation in the northern oasis of Mendoza, Argentina
Keywords:
reference evapotranspiration, irrigation programming, Hargreaves equation, water scarcity, adjustment coefficientAbstract
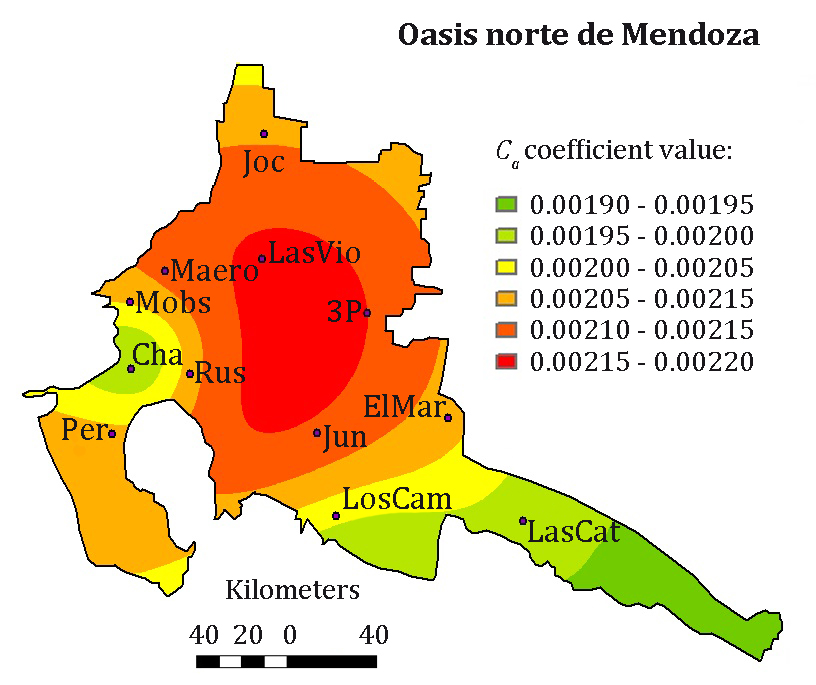
In view of the water scarcity that affects the province of Mendoza, Argentina, information on reference crop evapotranspiration (ET0) is crucial for irrigation scheduling. Data that are not generally available is required for the determination of ET0, with the Penman-Monteith FAO56 equation (PM). The Hargreaves equation (HG), which only requires air temperature data, represents an alternative to calculate ET0, after its local or regional calibration with PM. In this paper, the Hargreaves equation was calibrated locally by means of annual (Ca) and monthly (Cm,j) adjustment coefficients for the northern oasis of Mendoza. Also, a regionalisation of the Ca was performed considering environmental variables. The local adjustment with both coefficients made it possible to correct the positive bias that indicated an overestimation of HG with respect to PM in 12 meteorological stations. The mean value of the root mean square error decreased from 0.80 mm day-1 to 0.57 mm day-1 with the Ca adjustment coefficient, and to 0.55 mm day-1 with the Cm,j adjustment coefficient, while the absolute error decreased from 0.63 to 0.42 and 0.39, respectively. Wind speed was the variable that best explained the regional variability of the Ca (R2 = 0.64).
Downloads
Published
Issue
Section
License
Aquellos autores/as que tengan publicaciones con esta revista, aceptan las Políticas Editoriales.

